
Introduction
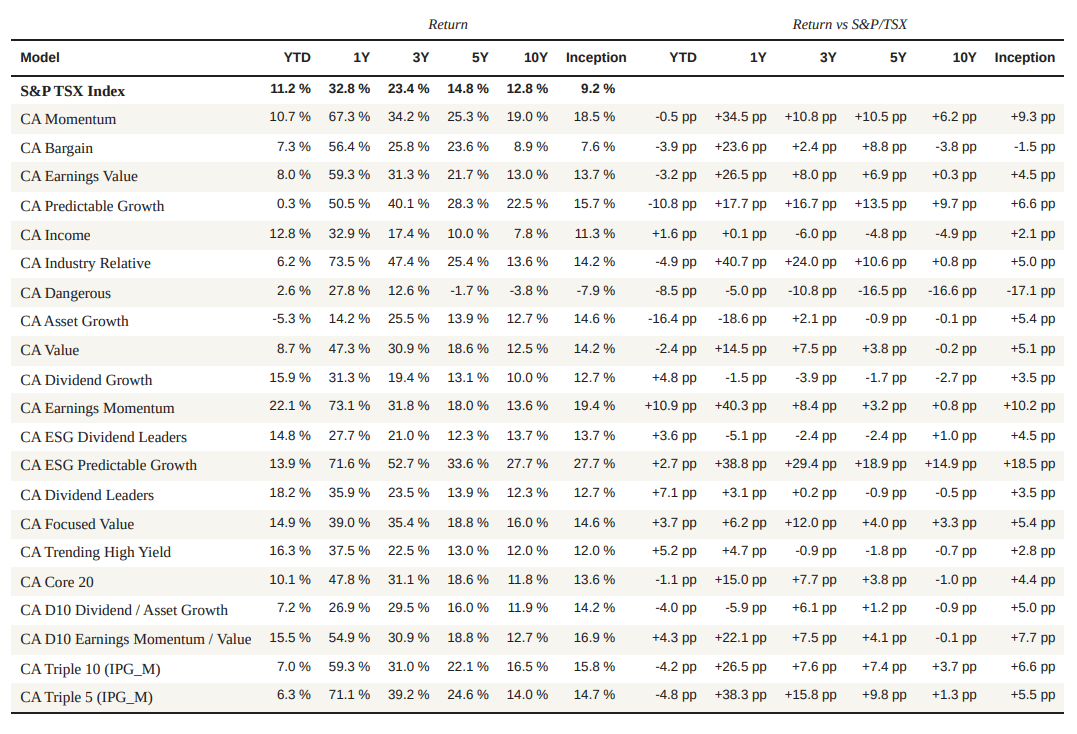
The first half of 2026 rewards Canadian equities, but in far tighter proportions than the major markets. The S&P/TSX advanced by 11.16 % yearto-date, while the median of Canadian factor models settled at 10.11 %, slightly below the index. Two facts frame the period. First, the median below benchmark: the S&P/TSX’s own concentration in its largest banks and energy majors set a high bar, and more than half the models, by stepping away from that cap-weighted core, missed it despite positive returns. Second, contained dispersion — 27 percentage points between the strongest and the weakest, a fraction of what a single-theme market produces. Canadian leadership was broad but coherent: energy and financials, the structural core of the market.
Performance summary — Canadian models · As of June 2026
Top-performing Models
The five leading models fall into two families that nonetheless converge on the same leadership. On one side, the earnings-momentum approaches, loaded with industrials, metals and energy (CA Earnings Momentum, CA D10 Earnings Momentum / Value), sharing a core of names — Enerflex, 5N Plus, Hudbay Minerals. On the other, the dividend and yield mandates (Dividend Leaders, Trending High Yield, Dividend Growth), dominated by financials. The link between them is Cenovus Energy, present in three Top 5 portfolios, and more broadly energy and financial services, each recurring across three leading models. That such different filters landed on the same names signals a market-wide leadership, not a construction accident: in Canada, the cyclical core — banks, pipelines, producers — was captured by momentum and dividend approaches alike.
The CA Earnings Momentum tops the ranking with 22.06 %, +10.9 pp above the S&P/TSX year-to-date. The portfolio balances across three cyclical blocks: industrial products (28.4 %), metals & minerals (21.0 %) and oil & gas (20.9 %), with no single one dominating. The model selects on upward earnings revisions, and those revisions lodged this year in the Canadian cyclical recovery — industry, base metals and energy. 5N Plus, Enerflex, Exchange Income, Bombardier and BlackBerry rank among the lead positions. Where the same screen would elsewhere produce a single-theme book, here it delivers a broadly diversified one: Canadian profit revisions spread across the whole resources-and-industry complex rather than one sub-sector, which explains both the top spot and the robustness of the composition.
The CA Dividend Leaders follows with 18.22 % (+7.1 pp vs the index). Financial services dominate at 41.0 %, extended by basic materials (19.4 %) and industrials (11.7 %). The model holds the highest, most reliable Canadian dividend payers — which, in Canada, means first the banks and the resource-royalty names. Bank of Nova Scotia, Toronto-Dominion Bank, Altius Minerals, Toromont Industries and Atco hold the lead positions. This is where Canadian market structure matters: unlike other markets, the largest Canadian dividends are precisely the banks and the energy and materials names that led the half-year. A dividend mandate therefore captured the leadership directly rather than being excluded from it — the bank rally and the mining royalties carried the book.
The CA Trending High Yield posts 16.31 %, or +5.2 pp above the benchmark. The allocation balances financial services (25.5 %) and energy (25.1 %), rounded out by basic materials (14.0 %) and real estate (10.5 %). The model pairs a yield screen with a trend overlay: it holds only high-yield names that are also rising. Amerigo Resources, Mullen Group, Tamarack Valley Energy, Rogers Sugar and TC Energy rank among the top positions. The specific mechanism of the half-year is the overlap, within Canadian energy, of income and momentum: pipelines and dividend-paying producers — TC Energy, Tamarack Valley — both paid and rose, exactly what the model’s dual screen is built to capture, where a yield filter alone might have held stagnant names.
The CA Dividend Growth ranks among the leaders with 15.92 % (+4.8 pp vs the benchmark). Its mix is more balanced than the pure-yield models: financial services (26.3 %), utilities (18.6 %) and oil & gas (17.7 %) share the core of the portfolio. The model favors sustainable dividend growers over the highest current yields. Power Corporation, CIBC, Quebecor, Secure Waste Infrastructure and Alimentation Couche-Tard dominate the allocation. The dividend-growth filter layers defensive compounders — Couche-Tard, Secure Waste — on top of the financials-and-energy base. Against the Dividend Leaders model, Dividend Growth trades some current yield for a steadier profile, which places it a notch behind the yield leaders in a period that paid immediate income more than growth.
The CA D10 Earnings Momentum / Value closes the leading group with 15.45 % (+4.3 pp above the benchmark). It is the value-tempered twin of the CA Earnings Momentum: the same industrial and resource base — industrial products (28.7 %), metals & minerals (12.4 %), oil & gas (9.8 %) — but with a value leg that keeps multiples in check. Bombardier, Hudbay Minerals, 5N Plus, Altius Minerals and Enerflex rank among the top positions — several shared with the leading model. That portfolio overlap with the CA Earnings Momentum is the tell: both screens converged on the same Canadian industrial and resource cyclicals, but MPCAEMV’s valuation discipline trimmed the return by excluding the priciest momentum names. The roughly +6.6 pp gap between the two measures the cost of that discipline in a rising cyclical market.
Lagging Models
The lagging models share one bias: a tilt toward gold and speculative miners that stayed outside the energy-and-financials leadership. The trait is not a selection flaw but a weighting one — two of them even held winning names (Enerflex, Cenovus, 5N Plus) before diluting them in a bullionheavy book or an over-broad diversification. The context amplifies the gap: with the cap-weighted index dominated by a handful of large banks and energy majors, any model that steps away pays a structural cost when those large names lead.
The CA Asset Growth brings up the rear with -5.26 %, -16.4 pp below the S&P/TSX. The portfolio spreads across gold (20.5 %), technology, biotech & pharma (17.7 %), merchandising (16.1 %) and industrial products (11.8 %). The model selects balance-sheet expanders, a signal that steered it toward gold, growth and consumer names rather than the mature financials and energy that led. Quebecor, Bombardier, Aritzia, 5N Plus and Dollarama dominate the allocation. The model did hold 5N Plus and Bombardier, two names present in the leading models — but drowned them in a gold-and-retail book that missed the leadership. Holding a couple of winners counted for nothing when a fifth of the portfolio sat in gold and a sixth in retail: the negative absolute return, against an index up more than eleven percent, illustrates the gap between good singlename selection and poor overall weighting.
The CA Predictable Growth loses ground with 0.32 % (-10.8 pp vs the benchmark). Exposure concentrates in gold (27.9 %), automobiles & components (9.8 %), diversified metals (9.5 %) and insurance (6.8 %). OceanaGold, Quebecor, National Bank of Canada, IGM Financial and Wesdome Gold Mines rank among the top positions. The near-thirty-percent weight in gold captures most of the shortfall: precious-metal producers stayed outside the energy-and-financials leadership, and the model’s stability bias kept it away from the energy cyclicals that rose. The near-flat return reflects a portfolio built for steadiness, mismatched to a half-year that rewarded the market’s cyclical core.
The CA Dangerous stalls at 2.64 % (-8.5 pp vs the benchmark). The portfolio loads diversified metals (32.9 %), gold (9.8 %), oil & gas services (9.7 %) and diversified financials (7.8 %). goeasy, Abrasilver Resource, First Quantum Minerals, Capital Power and Ivanhoe Mines hold the lead positions. The mandate — tilted toward higher-risk profiles — loaded diversified miners and juniors, a third of the book in diversified metals. These longer-horizon, high-beta bets are by construction disconnected from the current leadership of mature large caps: the model’s speculative bias is deliberately out of step with a market led by energy and banks this half-year.
The CA Industry Relative struggles to keep pace with 6.21 % (-4.9 pp below the benchmark). The portfolio forms a two-pole barbell: gold (38.9 %) on one side, technology hardware (30.4 %) on the other, with almost nothing between. Celestica alone represents more than thirty percent of the book, alongside Kinross Gold, DPM Metals, Iamgold and Neo Performance Materials. Celestica did its part, but nearly forty percent in gold producers weighed the model down. This exceptionally concentrated structure cuts both ways: one high-conviction winner offset by a heavy bullion leg that stayed outside the leadership. The industry-relative screen produced a narrow wager here, only the technology half of which paid off.
The CA Triple 5 (IPG_M) closes the group with 6.32 % (-4.8 pp below the benchmark). The notable fact: this model did hold the winning energy names. Enerflex is its top position (18.2 % in oil & gas producers overall) and Cenovus Energy ranks among the top five, alongside Rogers Sugar, NFI Group and Enghouse Systems. But the Triple 5 construction spreads the portfolio across a multitude of small sectors — food, software, transport — which dilutes the energy exposure. The model most clearly illustrates the half-year’s nuance: holding Enerflex and Cenovus, two of the names that carried the leading models, did not prevent a bottom-five finish. Diversification too broad scattered the position that should have led. Good selection was worth nothing without the right concentration.
Overall Reading
The Canadian half-year did not reward a single theme but a broad, coherent leadership: energy and financials, the structural core of the S&P/TSX, captured by two very different mandates — earnings momentum on industrial and resource cyclicals, and dividend on the banks and producers. That two filters this far apart converged on shared names — Cenovus, Enerflex, the banks — says enough that the leadership was market-wide. The 27-point dispersion is a third of what a single-theme market produces; it measures less the quality of the models than the distance between those whose mandate coincided with the cyclical core and those that stepped away toward gold.
Two consequences for the investor. First, the retreat of the gold-tilted models is no verdict on their construction: bullion and junior miners belong to a different regime — defensive, or an inflation surprise — in which the same bias that disappointed in an energy-led market would move to the front. The mismatch is a matter of regime, not merit. Second, the median below the index is a reminder of a constraint specific to the Canadian market: in a benchmark this concentrated in a few large names, active diversification carries a mechanical cost precisely when those large names lead. Holding the full range of styles, rather than betting on the one in favor, remains the only protection against the inevitable rotation of regimes.
Conclusion
The first half of 2026 confirms a durable trait of the Canadian market: its factor dispersion stays contained, and its leadership rewards the structural core — energy, financials, resources — rather than an isolated theme. The Inovestor suite is not meant to guess which regime will prevail, but to cover the styles that lead in turn, from bank dividends to resource momentum, as the Canadian cycle turns.