In a context of escalating geopolitical tensions and increasing economic fragmentation, the trade war between the United States and Canada poses a significant threat to the stability of Canadian portfolios. Tariff measures, regulatory restrictions, and protectionist industrial policies can rapidly weaken specific market segments, especially companies vulnerable financially, structurally, or sectorally.
With this in mind, we introduce the Market Fragility Portfolio on our Premium platform: a rigorous quantitative tool designed to identify the stocks most exposed, unstable, and least resilient during times of trade crises.
An Exclusion Strategy, Not Selection
Unlike our outperformance models, the Market Fragility Portfolio does not aim to outperform a benchmark. Its role is clear: to detect companies to avoid in a long-only portfolio, or to consider as short candidates in a long/short strategy.
This is a powerful negative filter designed to support sectoral and idiosyncratic risk management, particularly during macroeconomic shocks like a tariff war, which amplify existing vulnerabilities within publicly traded companies.
Quantitative Foundation: Price Stress + Increased Instability
The Market Fragility Portfolio relies on two fundamental criteria:
- PCHG4M ≤ M(-4.42%)
→ Stocks must have experienced a significant decline over the past 4 months, indicating a strongly negative trend or market confidence loss. - Volatility Ratio TRS90D / TRS300D ≥ 1.2
→ Short-term volatility (90 days) must be at least 20% higher than the long-term average (300 days), suggesting operational stress or heightened speculative sentiment.
Together, these conditions capture stocks experiencing imbalance, where the probability of further collapse, earnings warnings, or restricted financing access becomes significant.
Why is this Relevant in a Trade War Context?
The tariff crisis between the United States and Canada introduces systemic uncertainty regarding:
- Cross-border supply chains
- Operational margins of exporters
- Stability of demand for Canadian manufactured products
- Valuation of companies sensitive to foreign inputs
In such environments, companies already demonstrating prolonged market underperformance combined with rising volatility are typically most negatively impacted by new external shocks. Thus, the Market Fragility Portfolio serves as an advanced signal of fragility, useful to:
- Avoid value traps
- Reduce the implicit beta of portfolios
- Optimize short positions in a long/short sectoral model
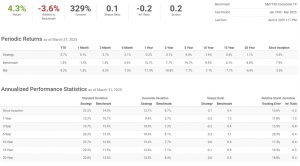
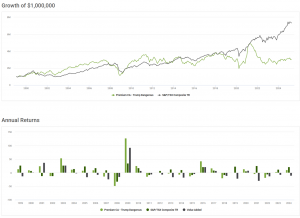
Backtest Results – “Premium CA – Market Fragility” Strategy
Period: January 1999 – March 2025 | Benchmark: S&P/TSX Composite TR
The Market Fragility strategy was developed to identify the most at-risk Canadian stocks during financial crises. Over 25 years, results align consistently with this objective: an annualized return of 4.3%, compared to 7.9% for the S&P/TSX Composite TR, demonstrating controlled underperformance of 3.6%.
This underperformance is not a failure but empirical proof that the strategy effectively isolates stocks to avoid in active or index management. Higher volatility (22.5%) and a low Sharpe ratio (0.1) underline the poor risk/return efficiency of these stocks—a strong argument for exclusion from structured portfolios.
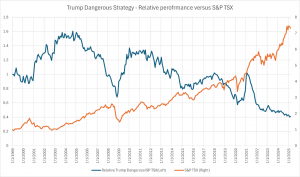
Historical Evidence: The Strategy Does Not Forgive Crises
Our results demonstrate that the Market Fragility Portfolio systematically underperformed the S&P/TSX during recent major economic stress events:
- 2008–2009: Relative loss exceeding 50% compared to the market.
- 2020 (COVID): Loss of over 25% within just two months.
- 2021–2025: Continued deterioration of relative performance, showcasing chronic weaknesses of these companies in adverse cycles.
The sole exception—the tech crash of 2000–2002—is attributed to a sector anomaly: the Market Fragility Portfolio did not contain the heavily impacted tech mega-caps (Nortel, JDSU), temporarily granting a relative advantage.
Practical Applications for Managers and Advisors
- Negative Filtering in a Core Equity Approach: Exclude the 50 worst stocks according to our criteria to avoid asymmetric losses.
- Short Component in a Market-Neutral Portfolio: Use Market Fragility as a basket for short positions against a portfolio of robust long positions.
- Proactive Monitoring of Stress Signals: Track variations of the TRS90D/TRS300D ratio to detect companies transitioning between regimes.
Available on our Premium Platform
The Market Fragility Portfolio is integrated into our Model Marketplace, fully transparent and customizable, offering:
- Monthly updated portfolio components
- Comprehensive backtest from 1999
- Access to volatility metrics, negative momentum, and complementary fundamental factors
- Ability to adapt the filter for sector-specific, ESG, or client-specific portfolios
Conclusion
In an environment where geopolitical shocks and protectionist decisions can rapidly disrupt established market conditions, the Market Fragility Portfolio becomes a strategic tool essential for active management. It’s not about chasing gains, but about avoiding the most costly mistakes.