In our last Number Cruncher we discussed how United Airlines Holdings Inc (UAL: NASDAQ), Cummins Inc (CMI:NYSE), & Paccar Inc. (PCAR:NASDAQ) are companies with growth in their net operating profit and economic value added metrics.
Let’s begin with United Airlines Holdings Inc
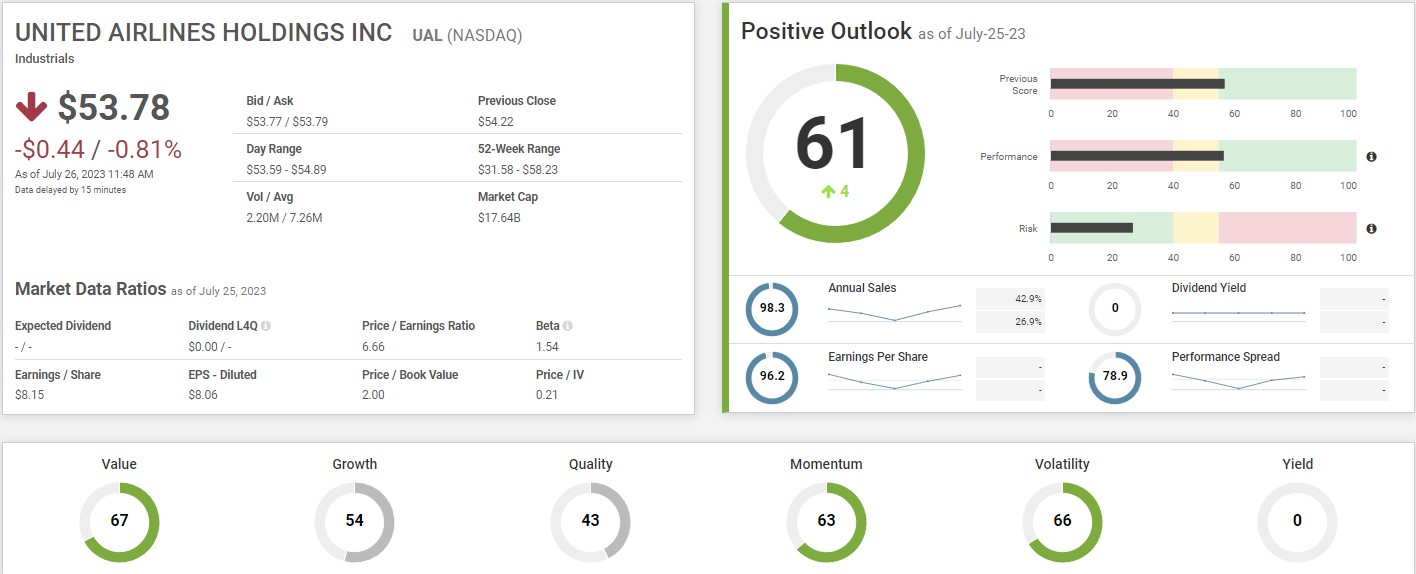
UAL has an SP Score of 61, up by 4 points in the past 90 days. This is derived by using the Performance score of 56.7 and the Risk score of 27. The company had a significant sales growth of 42.9% and has been able to maintain its 5Y sales growth average at 26.9%. However, the company had negative earnings in the previous quarters.
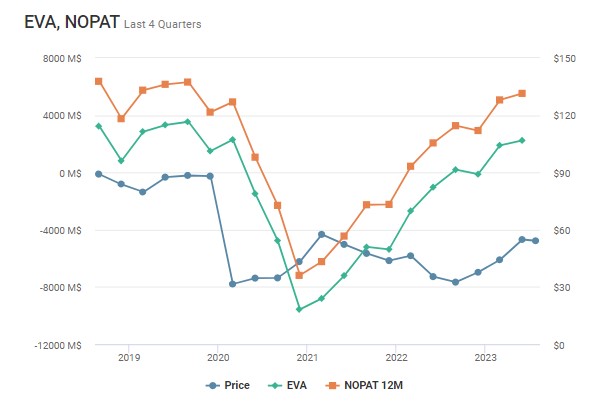
The company’s NOPAT and EVA shows a healthy uptrend when comparing last 4 quarters while the price seems to remain stable. According to our estimation the company seems to be undervalued with a 369.6% upside potential thus making it a strong buy. Caution is recommended for its previous negative earnings.
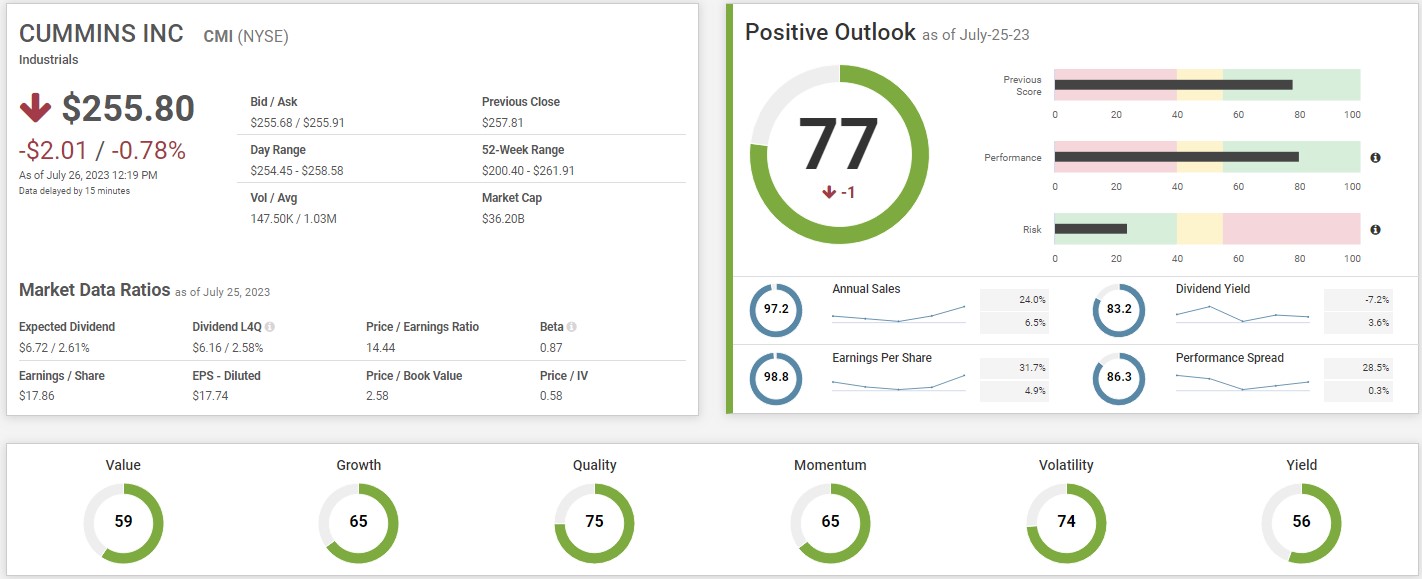
Cummins has an SP score of 77 (Performance score: 79.2 & Risk score: 24) in the past 90 days. The company has scored a quality score of 75 and a growth score of 65. The company had a 31.7% growth in its earnings per share in the last year and has been able to maintain an average 5Y earnings per share growth of 6.5%. Last year, the company saw an increase of about 24.0% in revenues.
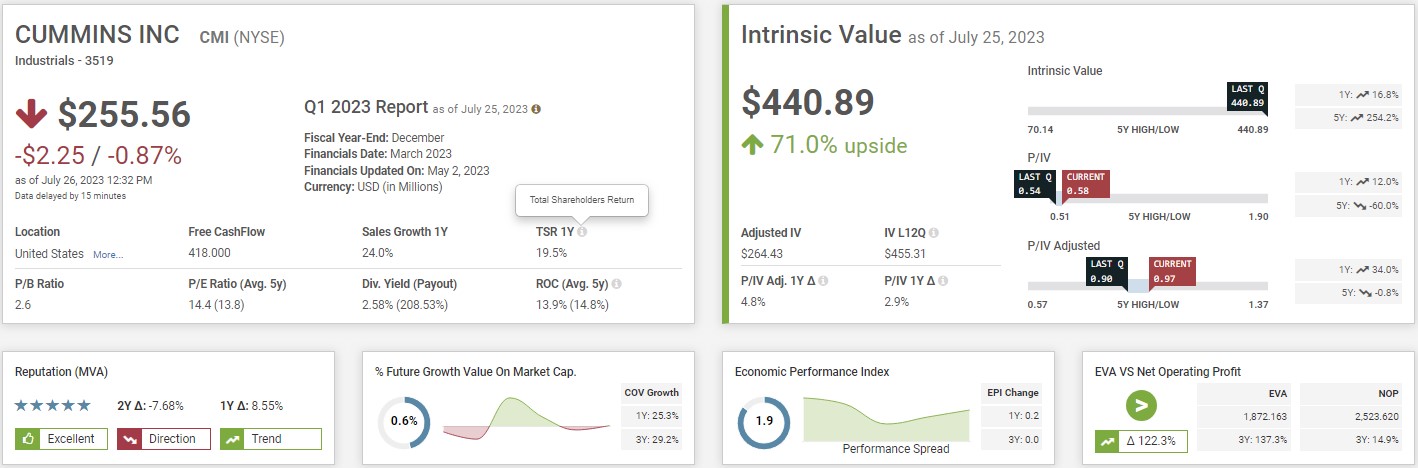
The company got a total shareholder return of 19.5%, an EPI of 1.9 showing that the return on capital was almost double the cost of capital. Our estimation gives about 71% upside making it a solid candidate based on this metric.
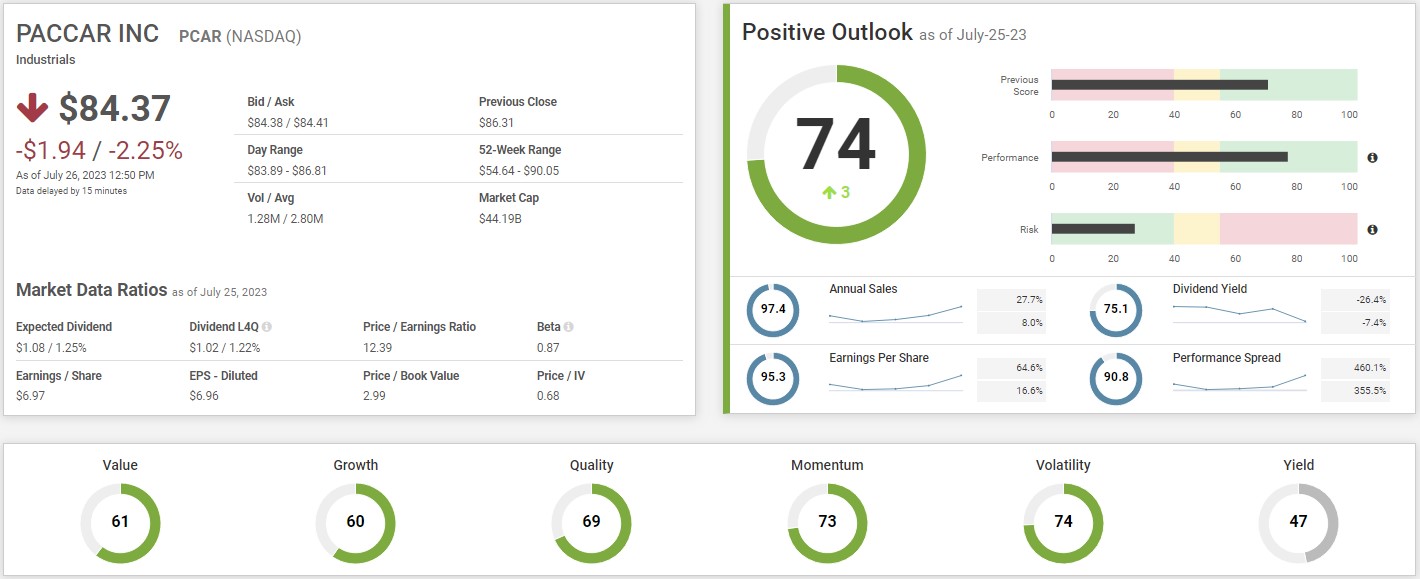
PACCAR’s SP score increased by 3 point, increasing to 74 within the last quarter. The company’s sales increased by 27.7%, however, showed a significant EPS growth of about 64.6% last year. The company has been able to maintain its 5Y average growth rate of earnings per share at about 16.6%.
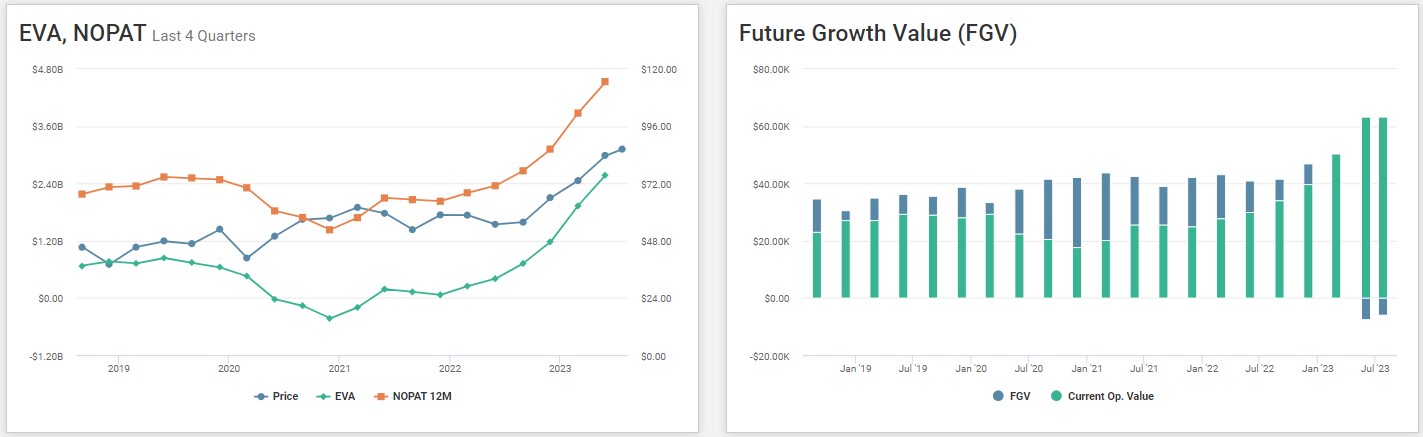
The company has been able to increase its NOPAT consistently for the past four quarters. The company’s current operating value is the highest for the last two years. Our line chart for EVA, NOPAT displays the steepness in the growth of these two factors compared to its price. It can be perceived that the EVA and NOPAT are increasing at a faster rate compared to the company’s price.
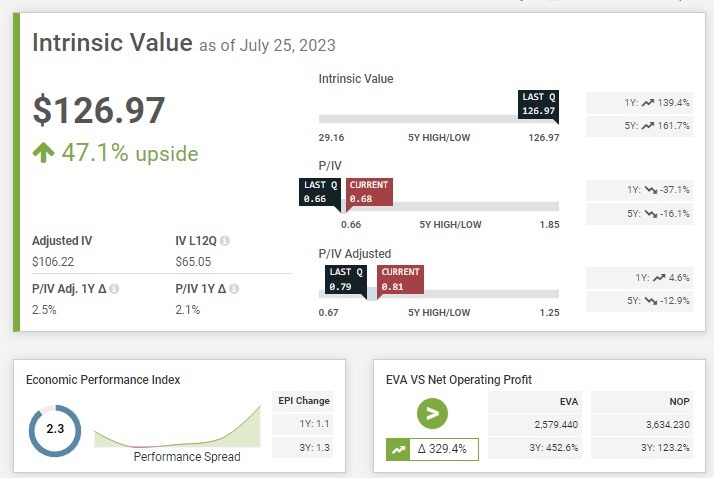
The company’s NOP has grown 123.2% whereas the company’s EVA has grown by a whopping 452.6% in the last three years. EPI number sits at 2.3 showing a strong return on capital compared to its cost of capital. If the current uptrend in the NOPAT continues, we estimate approximately 47.1% upside, making it potentially a buy.
If you have any questions about the article, feel free to contact Anthony :
amenard@inovestor.com
If you would like to sign up for a free trial and learn how Inovestor can benefit you, contact Ramzi:
rkahale@inovestor.com