In our last Number Cruncher, we discussed how Dropbox Inc. (DBX:NASDAQ), UFP Industries Inc. (UFPI:NASDAQ) & Murphy USA Inc. (MUSA:NASDAQ) are stocks with a track record of robust free-cash-flow-to-capital.
Dropbox Inc.
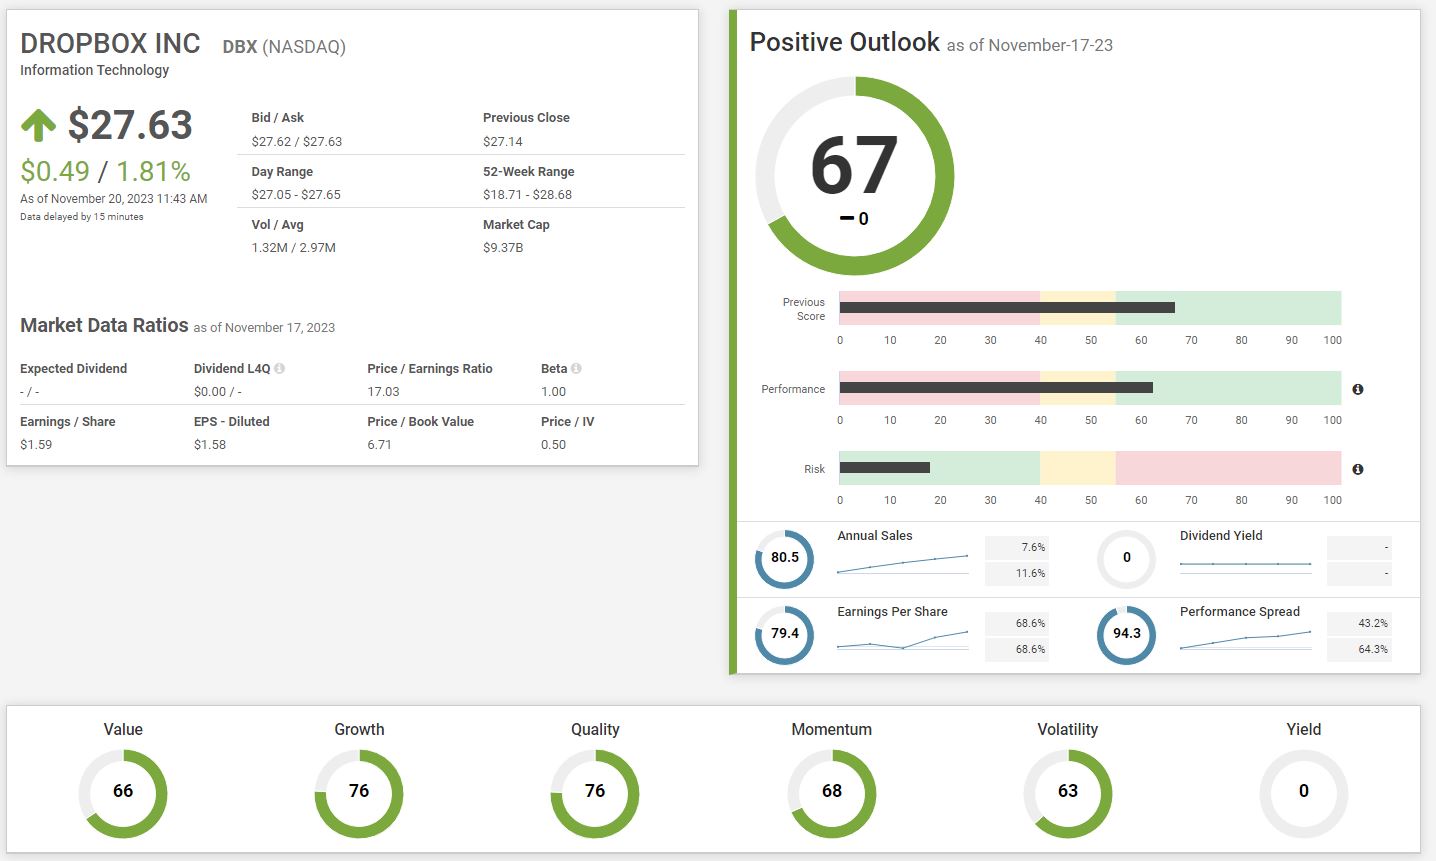
Dropbox Inc. (DBX:NASDAQ)’s SP Score remains unchanged at 67 compared to 90 days prior, comprising a Performance Score of 62.5 and a Risk Score of 18.2. Specifically, this company performs well in all its relevant factors (yield is irrelevant here as Dropbox Inc., a growth-oriented stock, doesn’t distribute dividends). The company experienced a 7.6% annual sales growth, adding to its 5-year average sales growth of 11.6%.
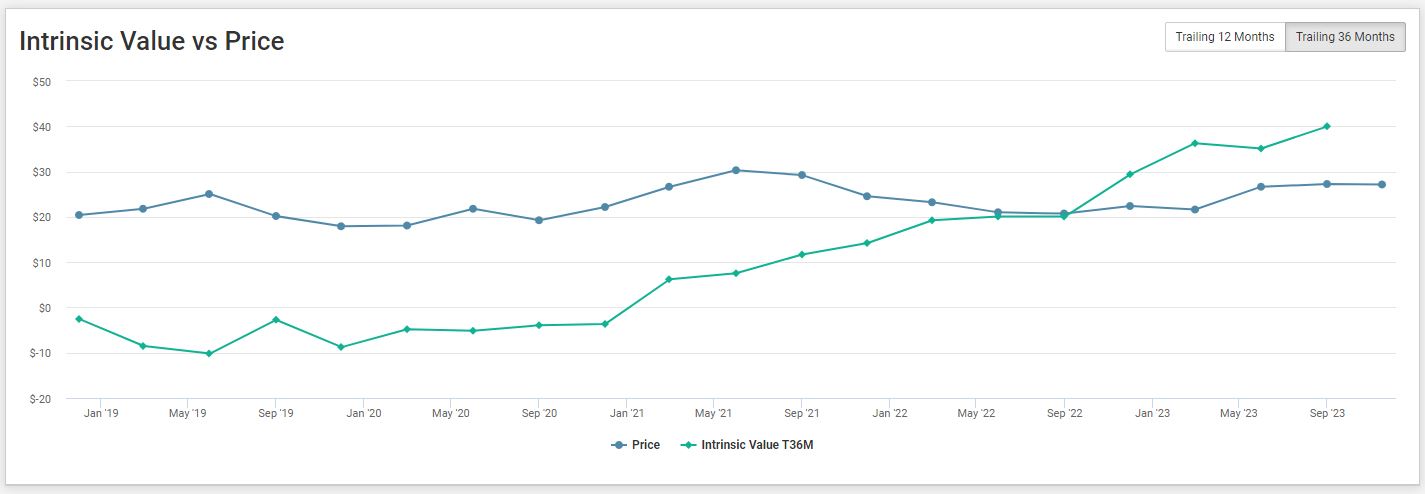
Dropbox saw a growth of 68.6% earnings per share (EPS) last year and is now at 1.59 EPS, surging back up from its negative earnings two years ago at -0.30, in September 2021. Since December 2019, the stock’s intrinsic value has shown a steady increase. This is likely due to the company’s consistent growth in its return over capital ratio (ROC), from 10.4% in September 2019 and 21.8% ROC in September 2023.
Relating to the Number Cruncher article detailing these three stocks, Dropbox Inc. currently has a P/E ratio of 17, which seems to fall below expectations in the case of technology stocks. When you see stocks like Adobe Inc. with P/E ratios of 55 (as of when this article is written), or like Oracle Corp. at 35, a P/E of 17 suddenly seems surprisingly low.
UFP Industries Inc.
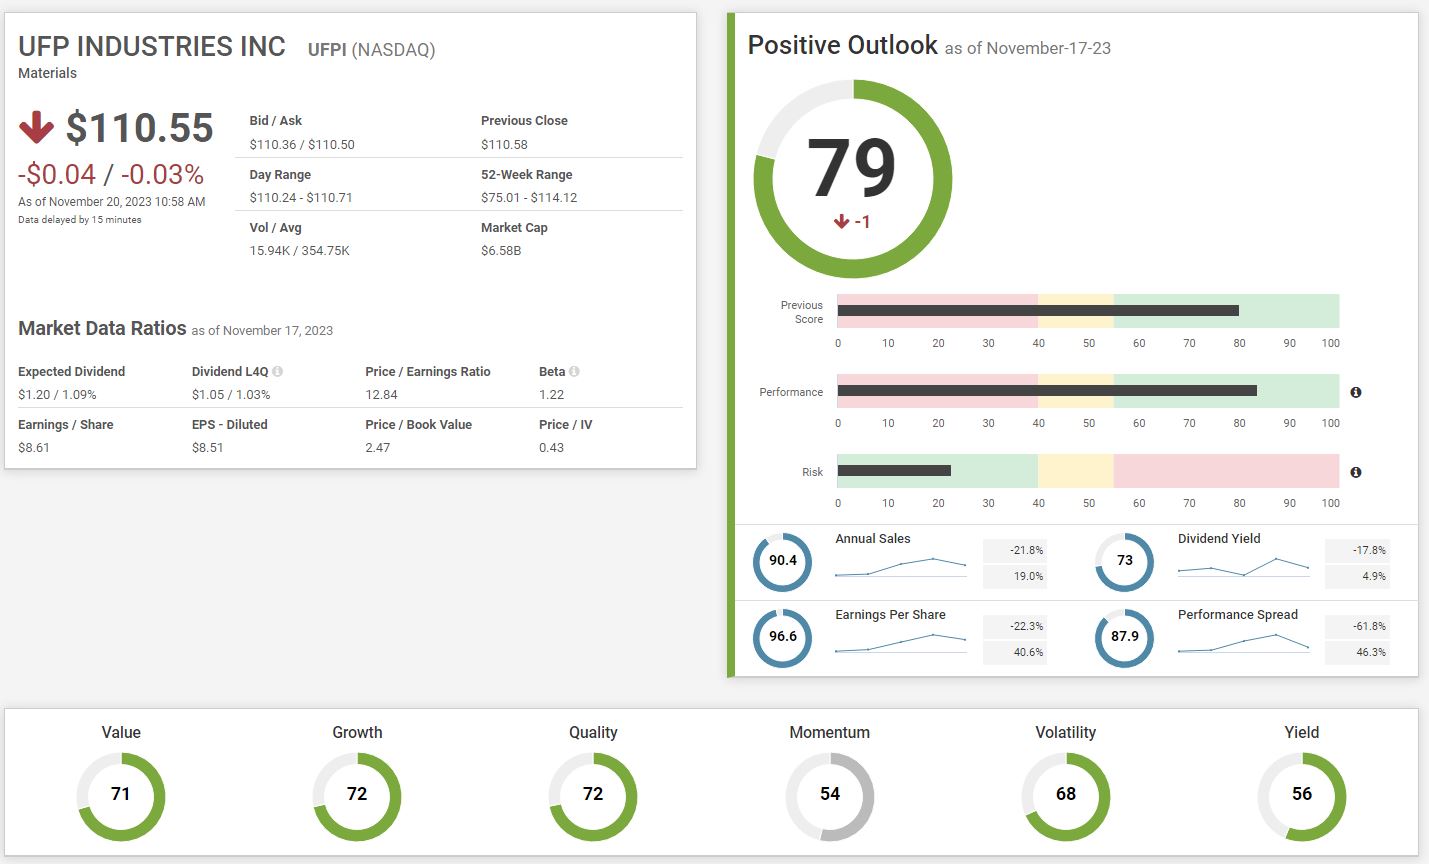
Similarly to Dropbox, UFP Industries Inc. (UFPI:NASDAQ) shows interesting financial trends, albeit with some distinct differences. UFPI’s SP Score fell by one point compared to 90 days prior, now standing at 79. The score is bolstered by a Performance Rating of 83.7 and a Risk Score of 22.6. UFPI is valued to be strongest in the factors of Value (71), Growth, (72), and Quality (72).
Contrary to the upward price movements, the annual sales growth, albeit solid with a score of 90.4, has seen a growth rate of -21.8%, a striking difference compared to its 5-year annual sales growth average of 19.0%. The decreasing performance of these two crucial metrics has contributed to the recent downward tilt of the stock’s EVA and NOPAT, ironically when the stock price is surging. The EVA, NOPAT graph illustrates this dynamic well.
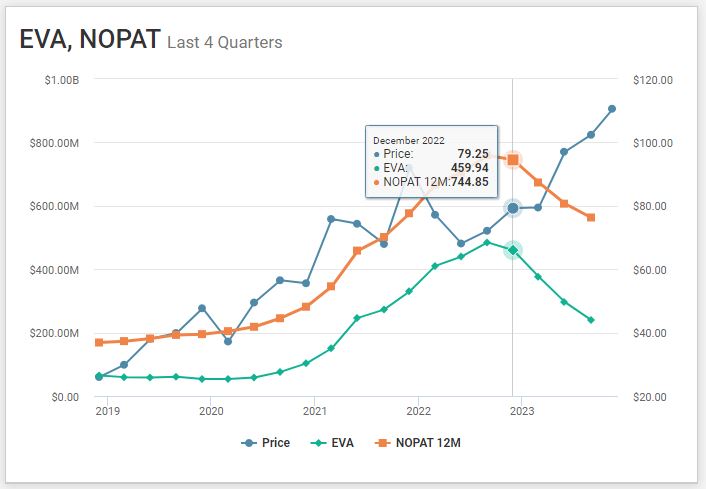
Interestingly, this doesn’t seem to be the first time it happens that stock price movements are seen to be in the inverse of financial performance: in 2022, there have been two consecutive quarters in which the stock price dropped significantly while EVA was growing, and it was only until September 2022 that the stock price followed suit and also grew. This has kept going for all the following quarters until the date this article was written. The Economic Performance Index (EPI) of 1.7, which means that the company generates 1.7x the expected return on capital considering the risks
Murphy USA Inc.
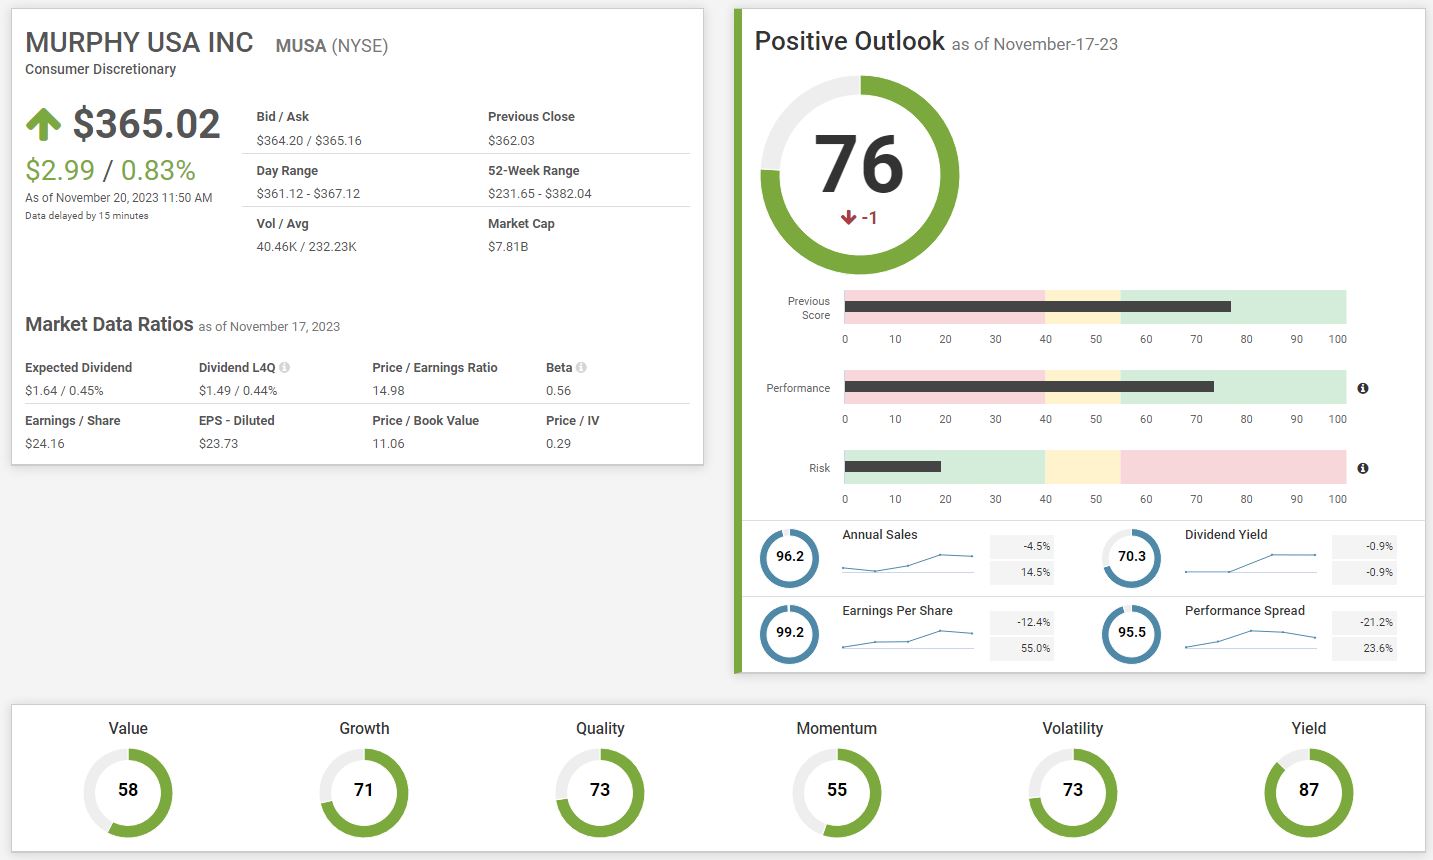
Murphy USA Inc. (MUSA:NASDAQ) currently has an SP Score of 76, a one-point decline over the past 90 days. This score is based on a Performance Score of 73.8 and a Risk Score of 19.4. This consumer discretionary stock scores above average on all factors, with its strongest ones being Yield (87), Quality (73), Volatility (73), and Growth (71).
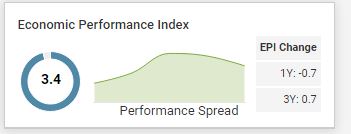
The EPI of the company sits at an amazing 3.4, and despite experiencing a small slowdown, still ranks in the 96th percentile.
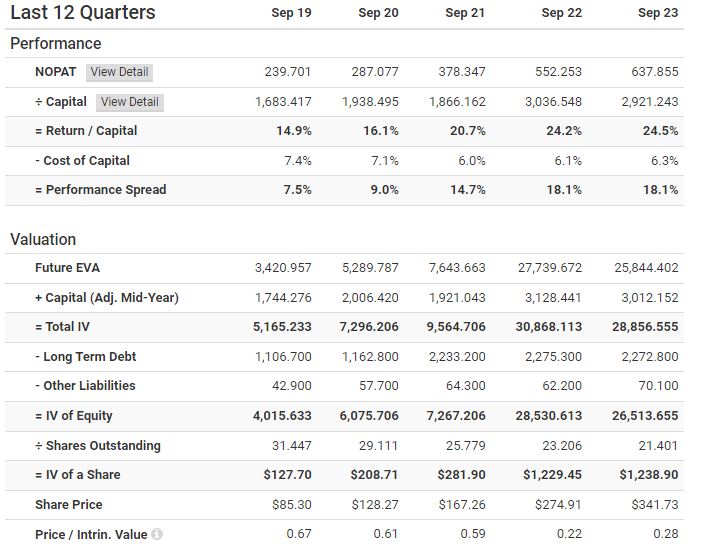
The stock’s ROC has consistently increased in the last five years, from 14,9% in September 2019 to 24.5% in September 2023. In a similar style of comparison, Murphy USA’s cost of capital has decreased (which is good), averaging 14.9% in September 2019 to 6.3% in September 2023.
If you have any questions about the article, feel free to contact Anthony:
amenard@inovestor.com