Introduction
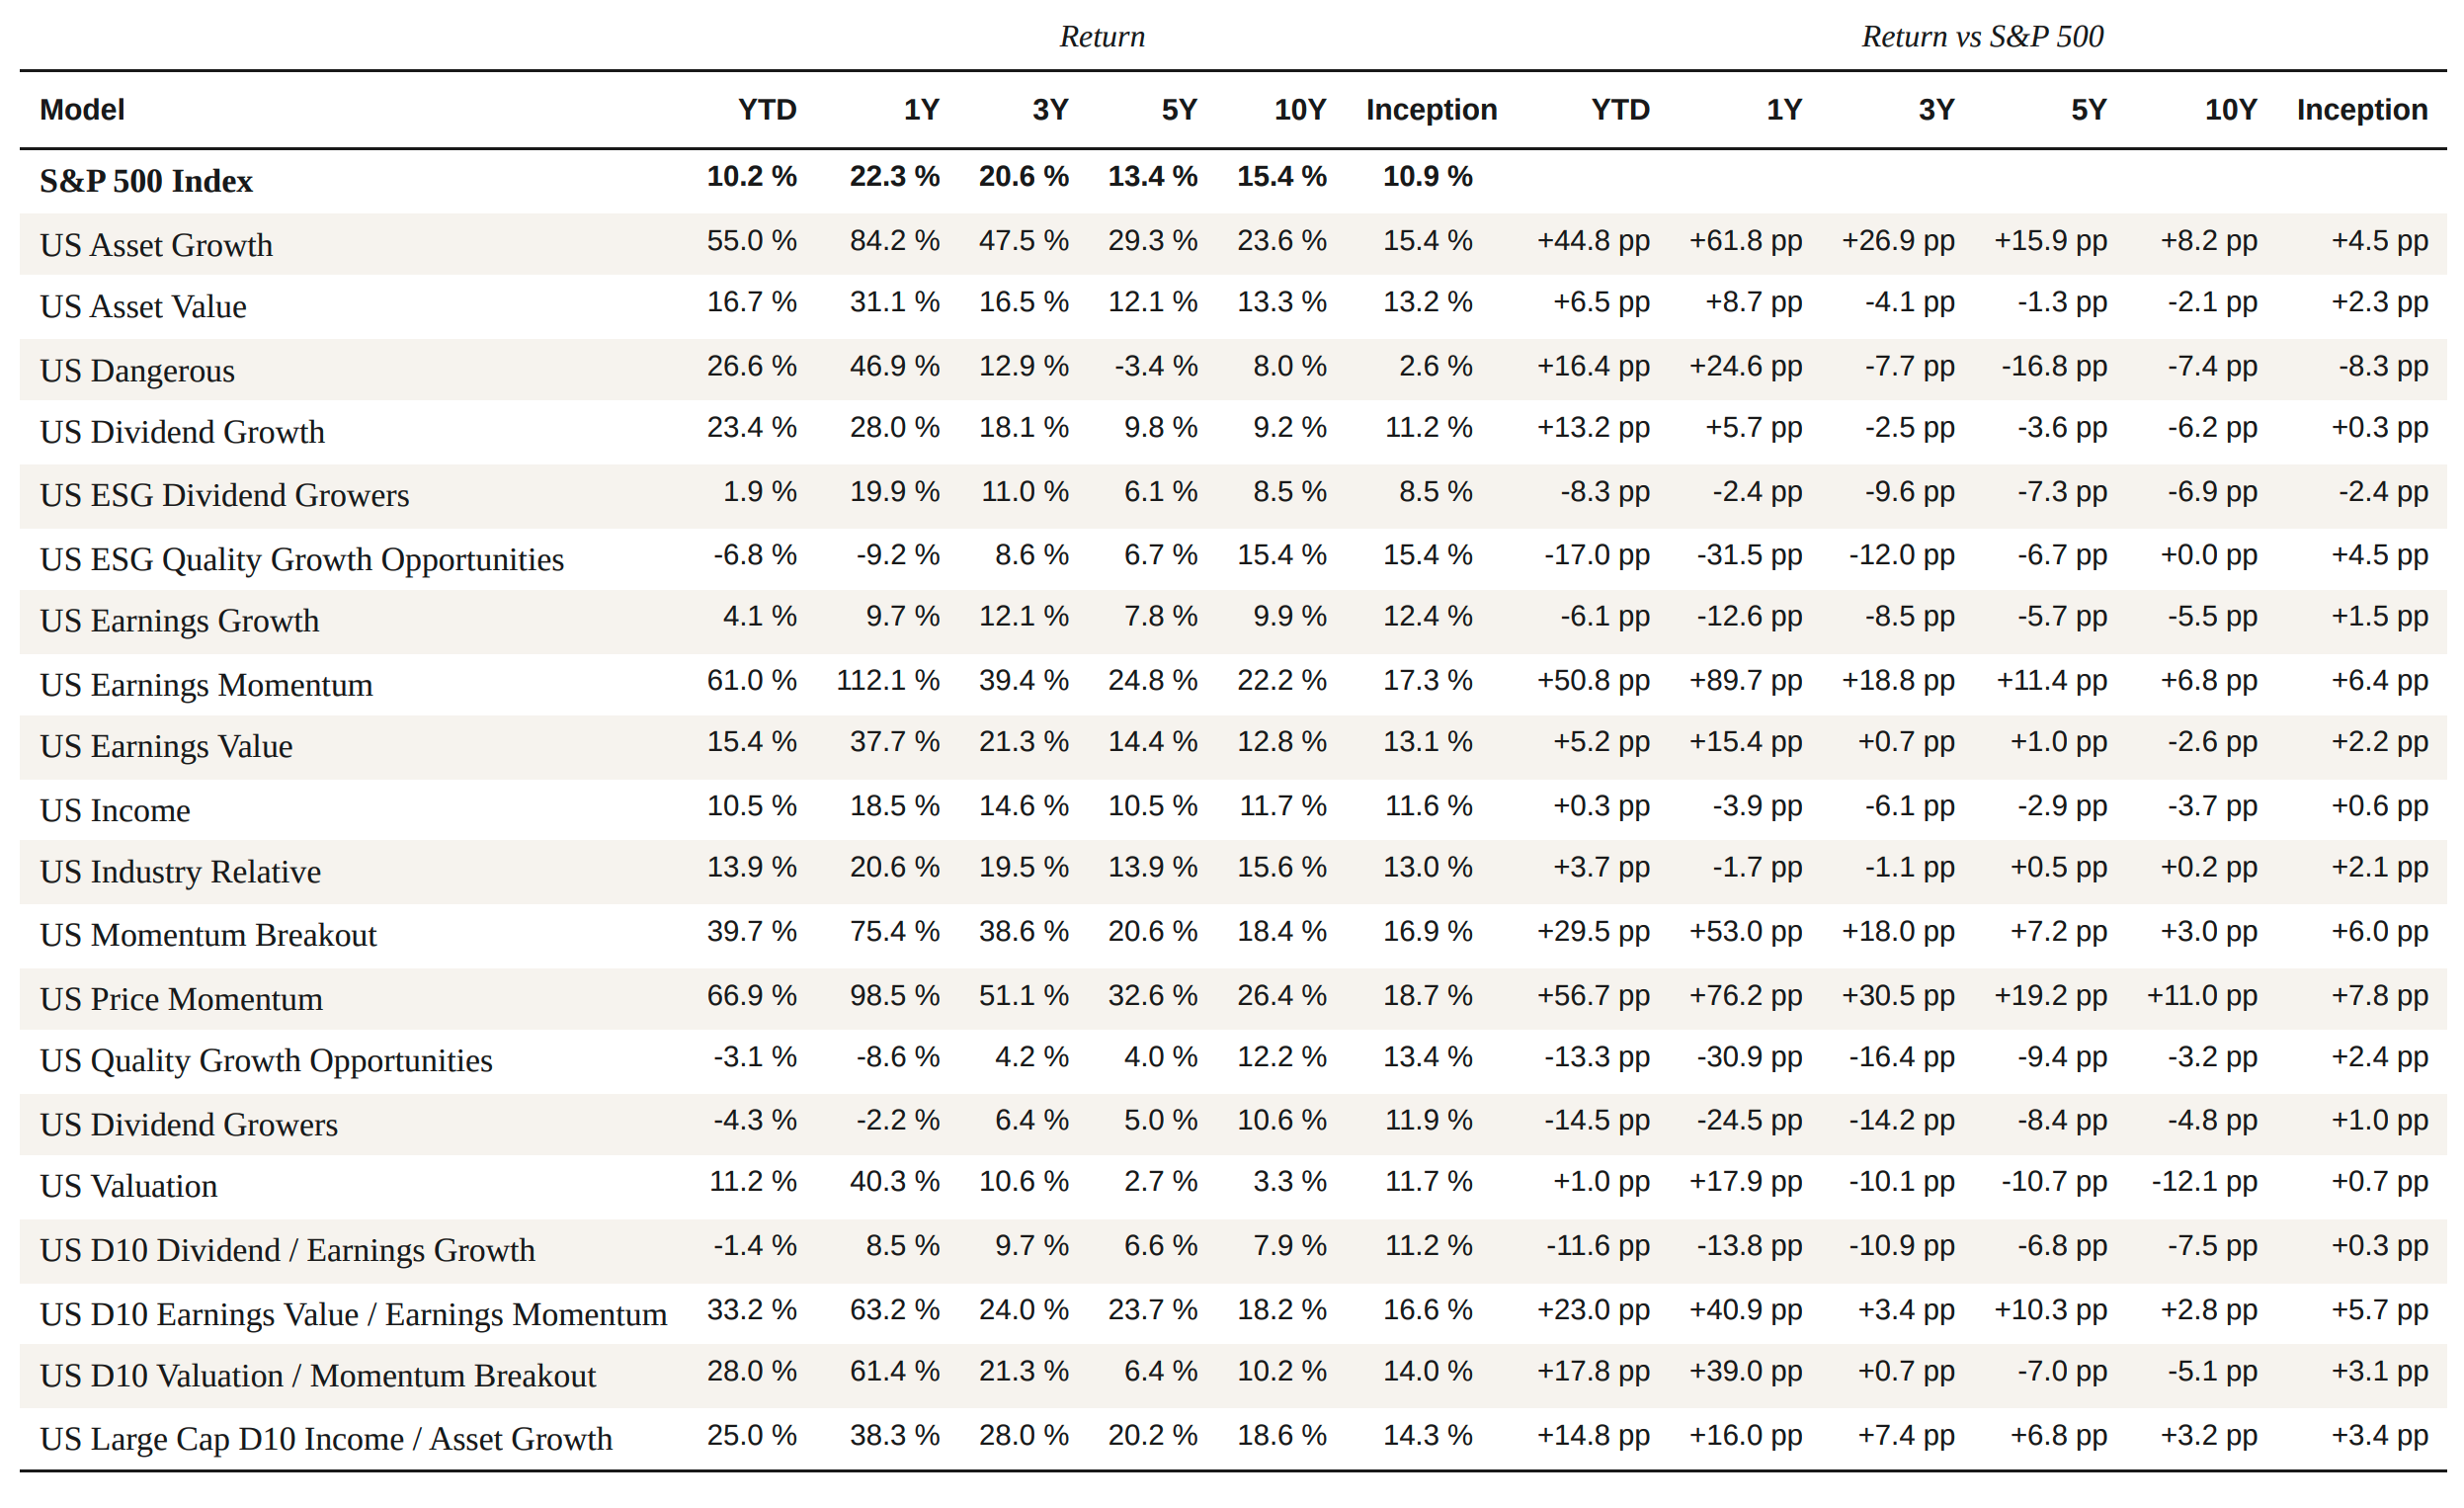
The first half of 2026 confirms the dominance of U.S. large caps — but above all the narrowness of their leadership. The S&P 500 advanced by 10.21 % year-to-date, while the median of U.S. factor models settled at 16.69 %, well above the index. Behind that median opens an unusual dispersion: 74 percentage points separate the strongest model from the weakest. This gap does not measure differential quality across approaches; it measures the amplitude of a leadership concentrated on a single theme — the equipment of intensive computing — which momentum and growth models captured without reservation, and from which quality, dividend and ESG mandates remained structurally excluded.
Performance summary — U.S. models · As of June 2026
Top-performing models
A single engine ties the five leading models together: information technology and industrials dominate each of their portfolios, and a core of identical names recurs across them. Micron, Seagate and Western Digital — memory and storage — rank among the lead positions in three of the Top 5 models, alongside the semiconductor-equipment makers Kulicke & Soffa, Teradyne and Credo Technology. The convergence is no coincidence: it reflects the fact that approaches as different as price momentum, earnings momentum and asset growth were all drawn toward the same beneficiaries of the memoryrestocking cycle and the equipment tied to intensive computing. The refiner Delek US Holdings even runs through four of the five portfolios, a sign that the wave spilled beyond the technology complex alone.
The US Price Momentum tops the ranking with 66.86 %, a margin of +56.7 pp above the S&P 500 year-to-date. Nearly three-quarters of the book (77.4 %) sits in information technology — a concentration the model’s own mechanics make unavoidable: by ranking stocks on price trend alone, with no valuation filter and no diversification constraint, it loads whatever is rising fastest. Lumentum in optics, Micron and Seagate in memory and storage, SanDisk and TTM Technologies hold the lead positions. That absence of a counterweight explains the result: the model rode the strongest trend of the half-year to its fullest — memory and optical suppliers pulled along by the buildout of computing capacity. Where the U.S. Earnings Momentum reaches neighboring names through earnings revisions, this one selects them directly on price — a mechanism that amplifies the move in both directions and would make the path just as quick on the way down if the trend broke.
The US Earnings Momentum follows with 61.00 % (+50.8 pp vs the index). Information technology accounts for 50.7 % of the portfolio, but the allocation spreads wider than price momentum’s: industrials (16.5 %), materials and financials all find a place. The model selects on upward earnings revisions, and those revisions clustered this year in the semiconductor supply chain — memory, test, packaging, components. SanDisk, Western Digital, Amkor Technology, Vishay Intertechnology and FormFactor rank among the main positions. The model thus reaches the same theme as the U.S. Price Momentum, but through a different door: not the fastest-rising names, but those whose profit estimates were repricing as the memory cycle turned. That revision engine runs deeper into the chain — down to the test and packaging subcontractors — where price momentum stopped at the largest, most visible names.
The US Asset Growth posts 54.99 %, or +44.8 pp above the S&P 500. Information technology dominates at 61.0 %, extended by industrials (16.1 %) and consumer discretionary (12.2 %). The model selects firms expanding their balance sheet and capacity, and that expansion lodged this year in storage, memory and the physical suppliers of intensive computing. Seagate, Micron and Western Digital sit alongside Vertiv Holdings — data-center power and cooling — and Lam Research among the lead positions. Where the two momentum models capture the theme through the stocks themselves, this one reaches it from the capex side: the companies building capacity rather than those selling into it. The overlap is no accident — the wave of investment in computing capacity is, by nature, balance-sheet expansion, precisely the signal this model screens on. The result reflects that alignment between the model’s mandate and the dominant theme of the half-year.
The US Momentum Breakout ranks among the leaders with 39.72 % (+29.5 pp vs the benchmark). Its mix departs from the models above it: information technology carries only 26.1 %, roughly level with industrials (17.5 %), materials (13.2 %), financials and energy (8.9 % each). The model spots technical breakouts across every sector, which naturally extends its reach beyond the technology core. Seagate sits with Comfort Systems — data-center HVAC — the distributor TD Synnex, the industrial aluminum of Kaiser Aluminum and the equipment maker Kulicke & Soffa. The model therefore captures the same theme through its industrial periphery rather than its semiconductor core: the cooling, metals and distribution that accompany the capacity buildout. That indirect exposure delivered a real but more moderate slice of the move, which places the return a notch below the purely techdriven momentum models.
The US D10 Earnings Value / Earnings Momentum closes the leading group with 33.20 % (+23.0 pp above the benchmark). It is the most balanced of the five: information technology (19.6 %) and industrials (19.0 %) share top billing, ahead of financials (10.1 %), energy (9.5 %) and health care (7.4 %). The dual screen — value and earnings momentum — tempers the technology concentration: the value leg pulls selection toward cheaper cyclicals and industrials. Micron thus sits beside the builder Everus Construction, the fuel-cell maker Bloom Energy, Credo Technology and Kaiser Aluminum. That dual screen explains both the lower ceiling and the place in the Top 5: valuation discipline kept the priciest momentum names out, so the model took part in the theme through its cheaper adjacencies — construction, fuel cells, industrial metals — paired with a measured position in memory and semiconductors. It captured the move without fully embracing it, which is exactly what a value-tempered momentum mandate is built to do.
Lagging models
The lagging models share one trait: their mandate holds them structurally apart from the memory–semiconductor–industrial complex that led the market. Quality compounders, dividend growers, ESG filters — each of these frames favors mature, profitable, steady companies, the opposite of fast-expanding technology cyclicals. The striking fact is not that they lagged, but that three of them posted a negative return while the S&P 500 rose 10.21 %: in a market this narrow, not holding the dominant theme was enough to erase the contribution of the rest of the portfolio.
The US ESG Quality Growth Opportunities brings up the rear with -6.78 %, -17.0 pp below the S&P 500. The portfolio does hold 40.7 % in technology — but the wrong kind: the software and payments compounders Adobe, Autodesk, Fortinet and Mastercard, rounded out by Hilton Worldwide. The quality-growth screen selects durable margins and high returns on capital, which points toward software and payments rather than cyclical memory and hardware; the ESG overlay tightens the exclusion further. Yet the half-year rewarded precisely the names this frame is built to avoid — cyclical, capital-intensive, lower-margin. Holding nearly half the book in technology offered no help, because it was a technology structurally distinct from the memory–semiconductor core that led. The negative absolute return, against an index up more than ten percent, is the sharpest illustration of how narrow the leadership was: holding the right sector was not enough — one had to hold the right segment of it.
The US Dividend Growers loses ground with -4.26 % (-14.5 pp vs the benchmark). The allocation spreads across financial services (22.7 %), industrials (15.0 %), consumer cyclical and defensive, with technology cut to 8.6 %. East West Bancorp, Snap-on, Linde, Texas Roadhouse and Goldman Sachs rank among the main positions — mature, cash-generative payers. The model’s own requirement, a growing dividend, mechanically excludes the names that led the half-year: the memory and semiconductor-equipment leaders reinvest rather than distribute, and never clear the filter. The portfolio’s thin technology sleeve is bank-like and mature, not the trending segment. A regime that rewards heavily investing, non-distributing companies structurally sidelines a dividend mandate. This shortfall is the mirror image of the outperformance the same mandate would deliver in a market led by income and defense — the other face of the same coin.
The US Quality Growth Opportunities stalls at -3.08 % (-13.3 pp vs the benchmark). It is the ESG-unconstrained twin of the model just above it at the bottom, and its composition differs mainly in a tilt toward health care (25.9 %) ahead of technology (23.9 %), consumer cyclical (19.8 %) and financials (18.4 %). Exelixis, Cardinal Health, Mastercard, Nutanix and Hilton Worldwide dominate the allocation. The quality-growth mandate is the same, and the outcome nearly so: a few tenths of a point separate the two models. That proximity is instructive — whether or not one screens on ESG criteria, whether one leans toward health care or software, the quality-growth frame remained unable to reach the cyclical-hardware leadership. Stock selection did not decide the ranking; the mandate itself did — a universe of steady, profitable companies, by construction removed from the memory producers and equipment makers that concentrated the half-year’s returns.
The US D10 Dividend / Earnings Growth struggles to keep pace with -1.35 % (-11.6 pp below the benchmark). Unlike the quality models, this one did hold cyclicals: energy (21.2 %), financials (18.5 %), materials (12.9 %) and even 12.0 % in information technology. Frontline in oil tankers, First BanCorp and OFG Bancorp in Puerto Rican banking, NetEase and the fertilizer producer CF Industries rank among the top positions. Holding cyclicals offered no help, though, because they were the wrong ones: tankers, regional banks and fertilizer are commodity and shipping cyclicals disconnected from the computing-capacity buildout, and the technology sleeve did not reach the memory names. The dual screen — dividend and earnings growth — steered selection toward income-yielding cyclicals rather than the reinvesting hardware producers. The model captures an essential nuance of the half-year: the right sector label was worth nothing without the right sub-segment.
The US ESG Dividend Growers closes the group with 1.90 % — the only positive return in the bottom tier, yet -8.3 pp below the benchmark. The portfolio is highly concentrated: five positions gather more than half of it. Financial services (31.3 %), health care (22.3 %) and industrials (21.8 %) frame the allocation around Mueller Industries, Eli Lilly, Stifel Financial, New York Times and Goldman Sachs. Mueller Industries — copper and industrial products — is the name closest to the winning theme, adjacent to the capacity buildout without being part of it. That concentration cut both ways: a handful of large positions kept the model in positive territory, but well behind the index. The ESG-and-dividend mandate delivered stability, not participation — a defensible outcome for its purpose, simply mismatched to a half-year that paid concentration in a theme it could not hold.
Overall reading
The half-year highlights an unusual narrowness in U.S. leadership, organized around a single theme: the buildout of computing capacity, expressed most vividly through the memory-restocking cycle, semiconductor equipment and the physical infrastructure of data centers. The momentum and asset-growth models, mechanically drawn toward the strongest-trending and fastest-expanding names, captured all of it; the quality, dividend and ESG-constrained mandates remained structurally excluded, three of them even posting a loss against a rising index. The 74-point dispersion separating the top from the
bottom of the table therefore does not judge the quality of the models: it measures the distance between those whose mandate coincided with the theme and those whose mandate excluded it.
Two consequences for the investor. First, a half-year of this magnitude says nothing about what comes next: leadership this concentrated is unstable by nature, and the models that captured it did so by amplifying a single trend — a mechanism that works as much on the downside as on the up. Second, the current retreat of the quality and dividend models does not symmetrically foreshadow a probable outperformance tomorrow; it is its reverse. These mandates are built to hold up when the market broadens or turns defensive — precisely the regimes in which today’s leaders would struggle. Owning the dispersion, not just the winners of the moment, is the reason a multi-style model suite exists.
Conclusion
The first half of 2026 restates a constant truth of factor investing: over a short horizon, the style in favor takes most of the performance while the others fall behind; over the cycle, those shortfalls offset in proportions that depend on the market regime. The style diversification the Inovestor suite provides is not meant to lead every period — it is meant to navigate cycles with a balanced exposure to U.S. factor premia.
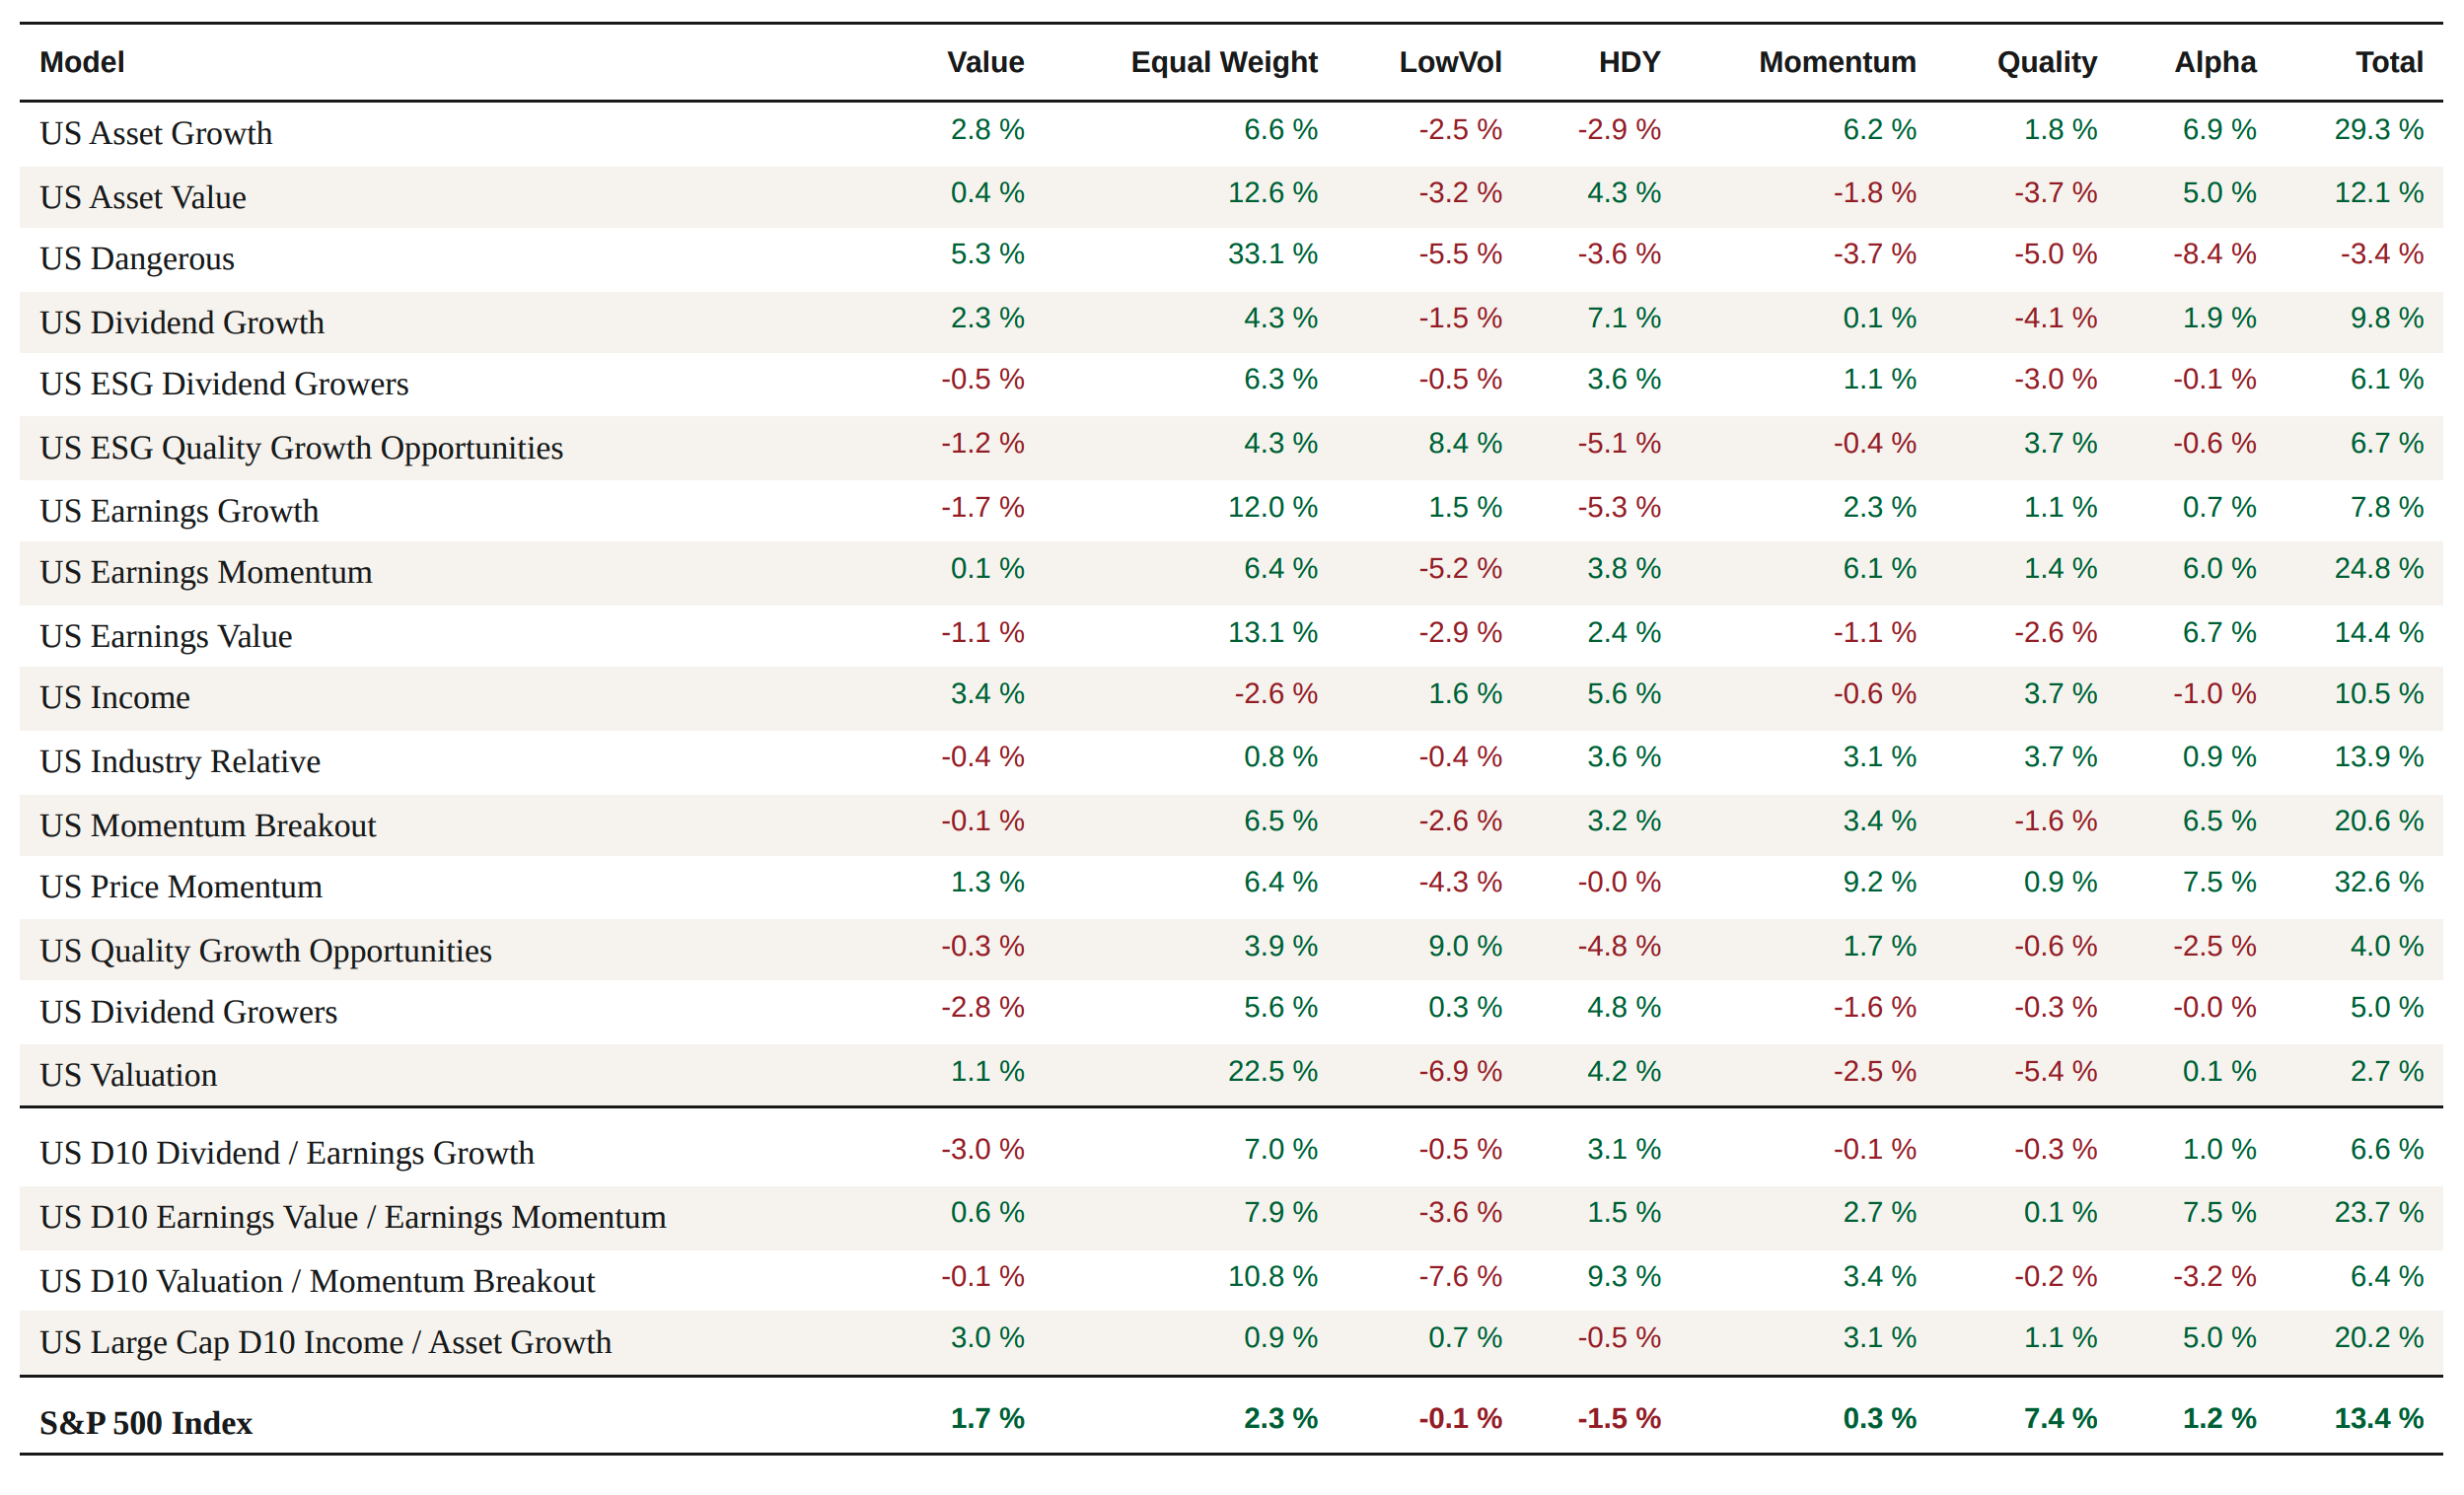
Factor contribution to performance
U.S. models — Factor performance contribution · 60-month window · As of June 2026