Performance Commentary — Canadian Factor Models (1Qtr-2026)
Introduction
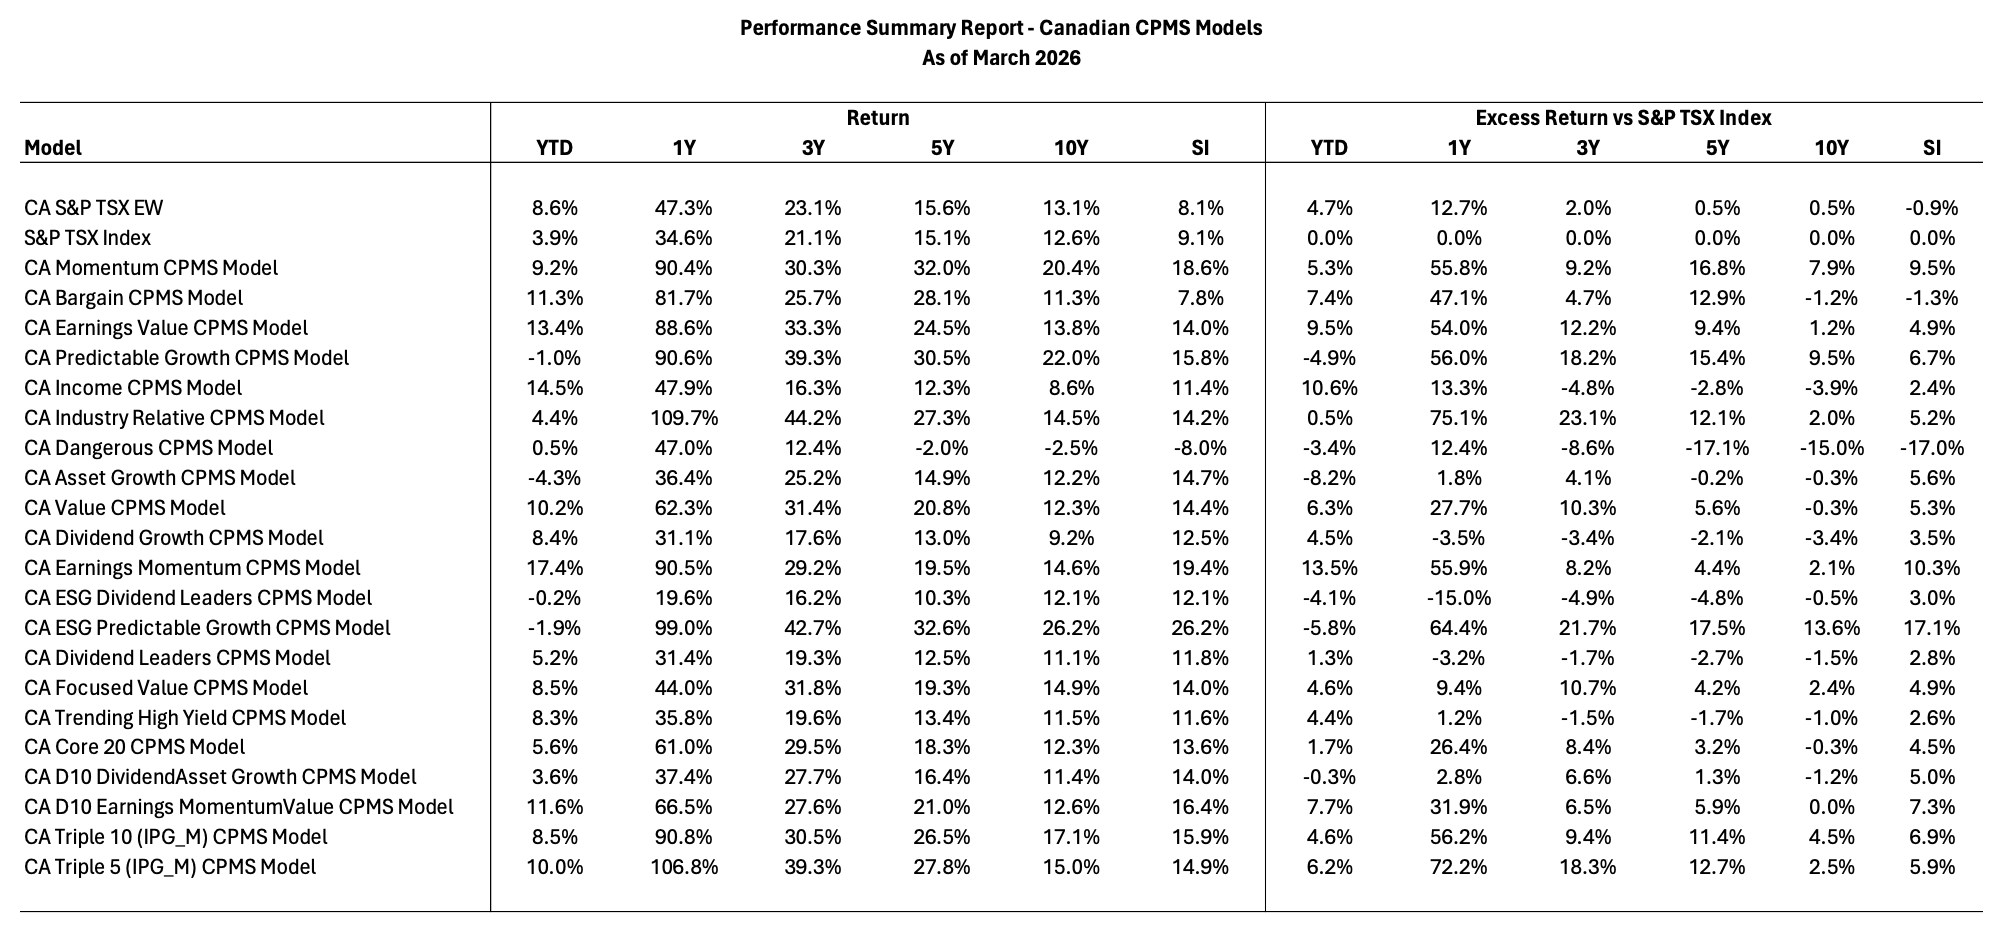
The first quarter of 2026 was relatively mixed for Canadian equities. The S&P/TSX gained approximately 3.90% over the period. Against this backdrop, the median return of Canadian factor models reached 5.60%, indicating overall outperformance. Behind this average, however, lies a significant dispersion between a handful of strongly performing models and several strategies that lagged.
Top-Performing Models
The best-performing models clearly benefited from strong exposure to resource sectors, particularly gold, as well as to energy and selected industrial segments.
The CA Earnings Momentum model led with a return of 17.40%. Its portfolio was heavily exposed to energy and metals-related companies, including Spartan Delta, Discovery Silver, SSR Mining, and Enerflex, which were key contributors to performance.
The CA Income model followed with 14.50%, supported by a combination of energy and financial holdings, including Suncor, Cenovus, Enbridge, and Pan American Silver, which delivered solid returns in a resource-driven environment.
The CA Earnings Value model returned 13.40%, with significant exposure to gold and energy producers, including SSR Mining, Endeavour Mining, and Cenovus.
The CA D10 Earnings MomentumValue model delivered 11.60%, combining gold producers and industrial companies, with notable holdings such as OceanaGold, Hudbay Minerals, and Bombardier.
Finally, the CA Bargain model closed the top group with a return of 11.30%, benefiting from a strong concentration in gold producers, including SSR Mining, Kinross Gold, and Iamgold, along with selected energy names.
Models Lagging the Market
In contrast, several models were held back by a more diversified structure or by exposure that was less aligned with the strongest segments of the market.
The CA Asset Growth model declined by 4.30%, with a more dispersed allocation including companies such as BRP, Quebecor, and Wesdome, which did not fully capture the strength of resource sectors.
The CA ESG Predictable Growth model fell by 1.90%, despite holdings such as Celestica, Kinross Gold, and Dollarama, whose contributions were not sufficient to support overall performance.
The CA Predictable Growth model declined by 1.00%, with exposure to companies such as OceanaGold, Quebecor, and Aris Mining, but without sufficient concentration in the best-performing segments.
The CA ESG Dividend Leaders model declined slightly by 0.20%, with significant exposure to financials and industrials, including CIBC, National Bank, and Toromont, which provided stability but limited upside.
Finally, the CA Dangerous model posted a modest gain of 0.50%, with exposure to energy and metals producers such as Vermilion Energy, International Petroleum, and Algoma Steel, but with a more dispersed structure that constrained performance.
Overall Perspective
The quarter highlights a strong concentration of performance in resource sectors, particularly gold, as well as in selected energy segments. Models with meaningful and concentrated exposure to these areas significantly outperformed the market. In contrast, more diversified approaches or those less aligned with these segments were at a disadvantage.
Conclusion
At the beginning of 2026, performance among Canadian models was largely driven by exposure to resource sectors and by concentration in the strongest-performing stocks. Strategies that embraced this concentration generated significantly higher returns, while more balanced models delivered more moderate performance. This complementarity between styles remains essential for navigating market cycles with discipline and consistency.
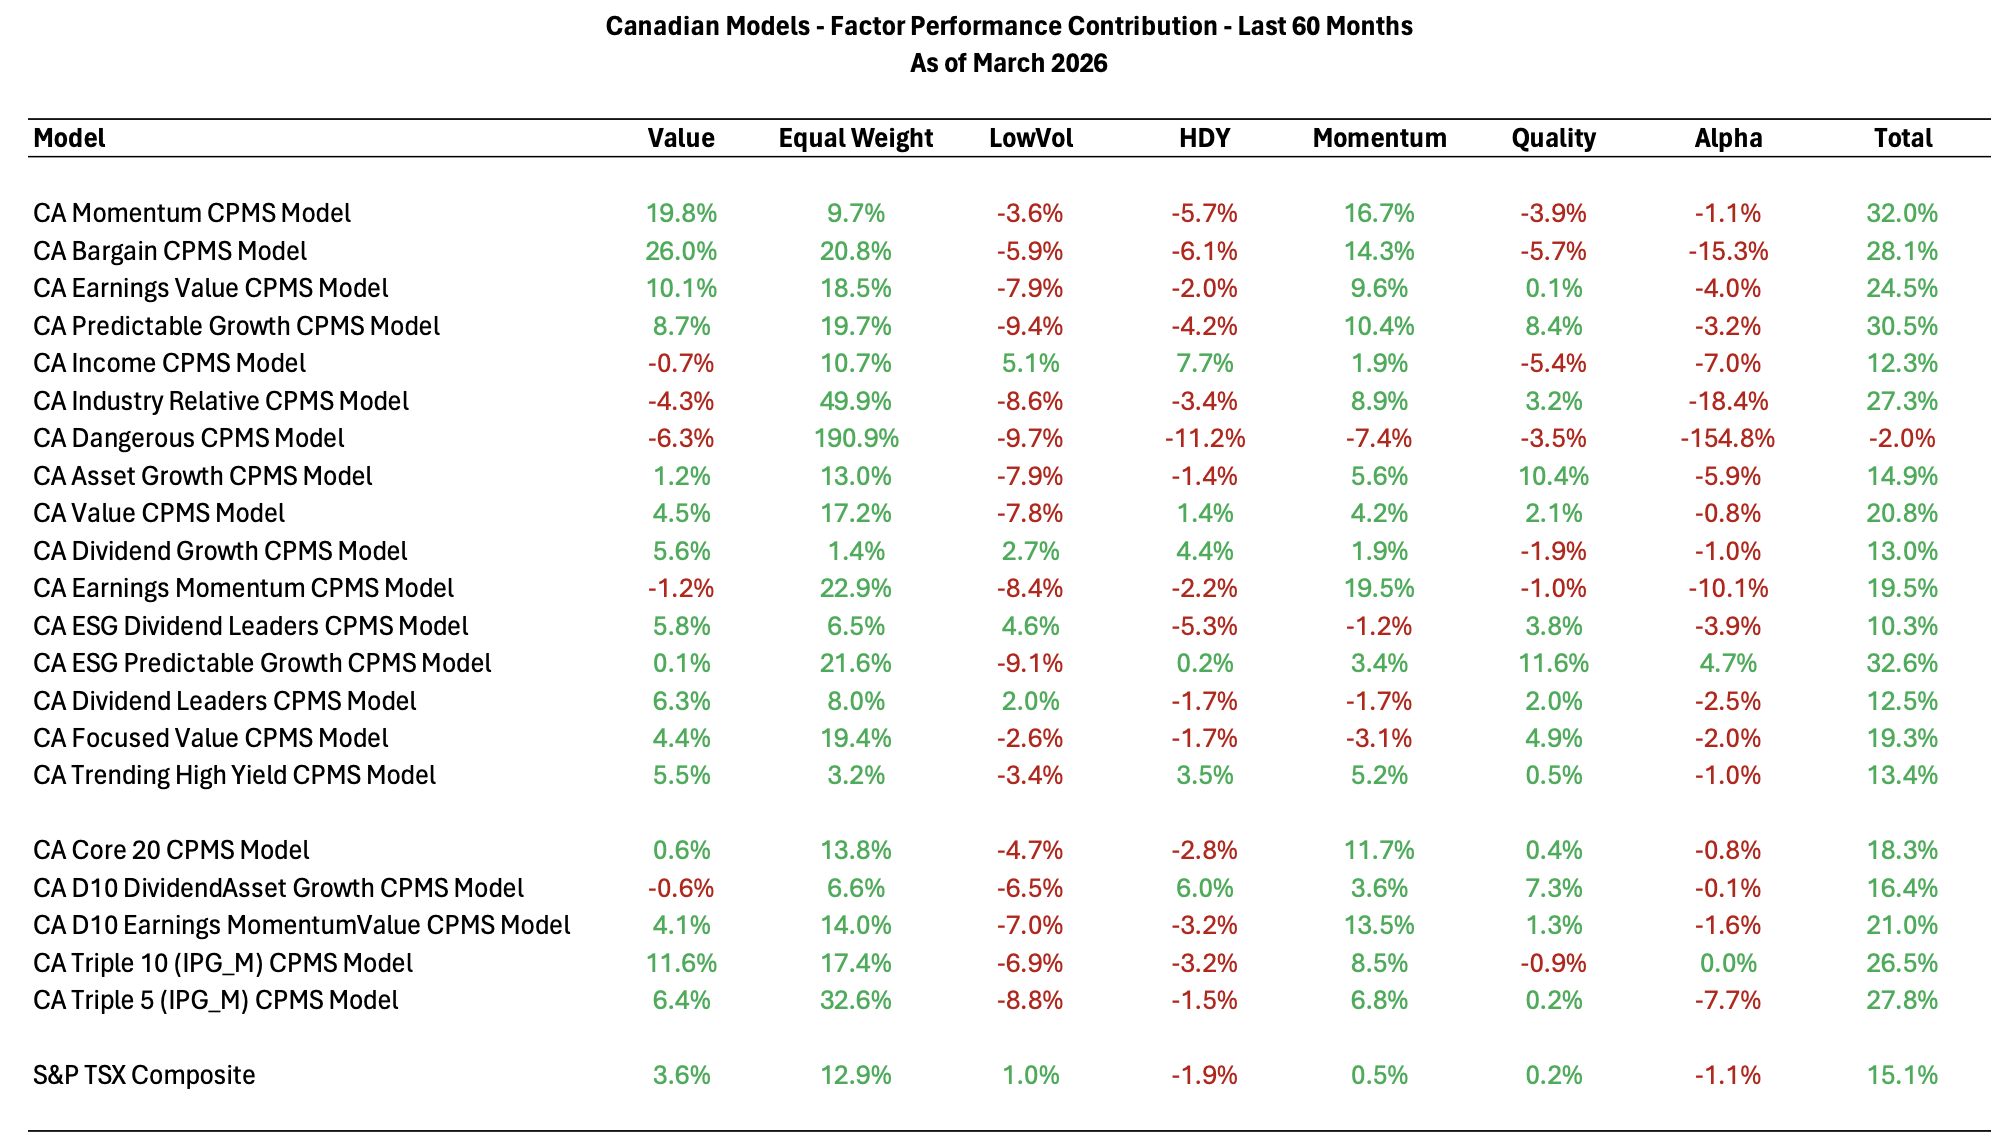
Factor Performance Contribution