As of December 31, 2025
The year 2025 ended on a very strong note for Canadian markets. The S&P/TSX Index posted a gain of 31.53% for the year, already a solid result. In this favourable environment, several models performed significantly better, while others delivered more moderate returns, depending largely on the sectors and companies held in the portfolios.
Overall, most models outperformed the benchmark. The median performance reached 59.20%, meaning that more than half of the strategies generated returns nearly twice that of the market. Behind this figure, however, lies an important reality: in 2025, what the portfolios owned made all the difference.

The top-performing models were driven by a few very specific themes. Industry Relative stood out with a return of 119.22%. This model benefited strongly from its exposure to gold-related companies and materials, as well as to certain industrial and technology stocks that performed exceptionally well. The portfolio’s results were heavily supported by companies such as Celestica, along with several gold producers, in a year when gold prices and related stocks played a central role in the Canadian market.
ESG Predictable Growth also delivered an outstanding year, with a return of 90.79%. Here again, the explanation is straightforward. The portfolio was heavily exposed to the technology sector, particularly Celestica, which represents a significant weight in the model, as well as to basic materials. As these segments advanced sharply in 2025, the model captured the upside effectively.
Predictable Growth, Momentum and Earnings Value round out the group of top performers, with returns ranging from 75.66% to 82.45%. These strategies share several common characteristics. All hold meaningful exposure to gold producers such as New Gold and OceanaGold, as well as to companies linked to metals and natural resources. Momentum and Earnings Value also benefited from well-positioned cyclical and financial stocks. Together, these exposures explain why these models significantly outperformed the index in 2025.
At the other end of the spectrum, income- and dividend-oriented models experienced a quieter year. ESG Dividend Leaders finished at 17.86%, Dividend Leaders at 21.80%, and Dividend Growth at 23.91%. Trending High Yield and Income performed somewhat better, at 34.51% and 35.03%, but still lagged the leading growth-oriented models.
These results primarily reflect their sector positioning. Dividend-focused models are heavily invested in Canadian banks, such as CIBC and National Bank, as well as in more defensive sectors like utilities, telecommunications, and certain oil and gas companies. These businesses tend to offer steady income and greater stability, but they benefited less from the strong momentum seen in gold, materials, and select technology segments in 2025.
In other words, the strongest-performing models were concentrated in a few powerful market drivers, while income-focused models favoured consistency and predictability. This difference largely explains the performance gap observed this year. It is also worth noting that several of the top-performing models hold similar stocks, particularly in gold and materials, which explains why their performance patterns closely resemble one another.
In conclusion, 2025 was a year in which sector and stock selection clearly dominated overall results. Strategies exposed to gold, materials, and select industrial and technology names significantly outperformed. Income-oriented models, for their part, delivered more measured returns, consistent with their objective of stability. For investors, the key challenge remains finding the right balance between participating in growth and maintaining diversification, in order to navigate different market cycles effectively.
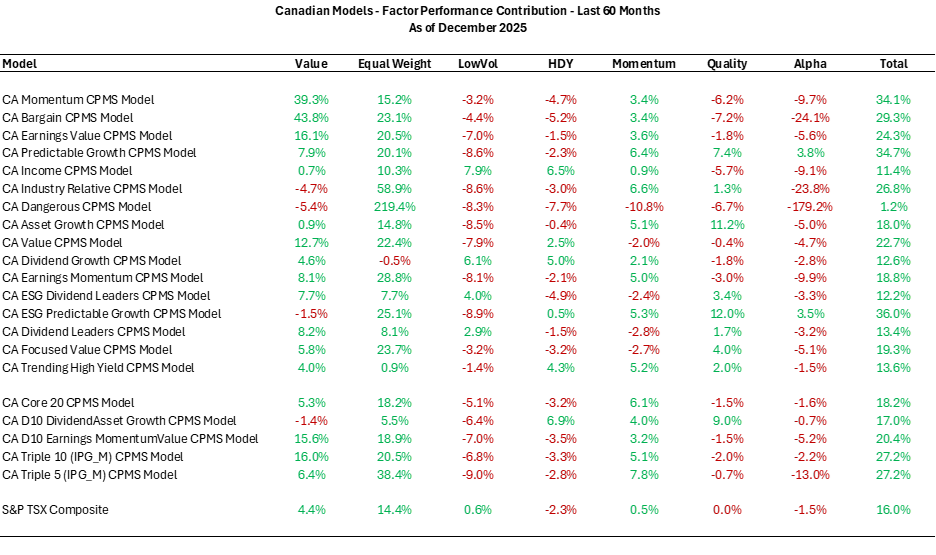
Performance – Factor Contribution (Last 5 years)