In the last Number Cruncher, we looked at non-cyclical companies that have demonstrated leadership relative to its Industry and sustained efficiency with growth and value characteristics.
Toromont Industries (TIH-T)
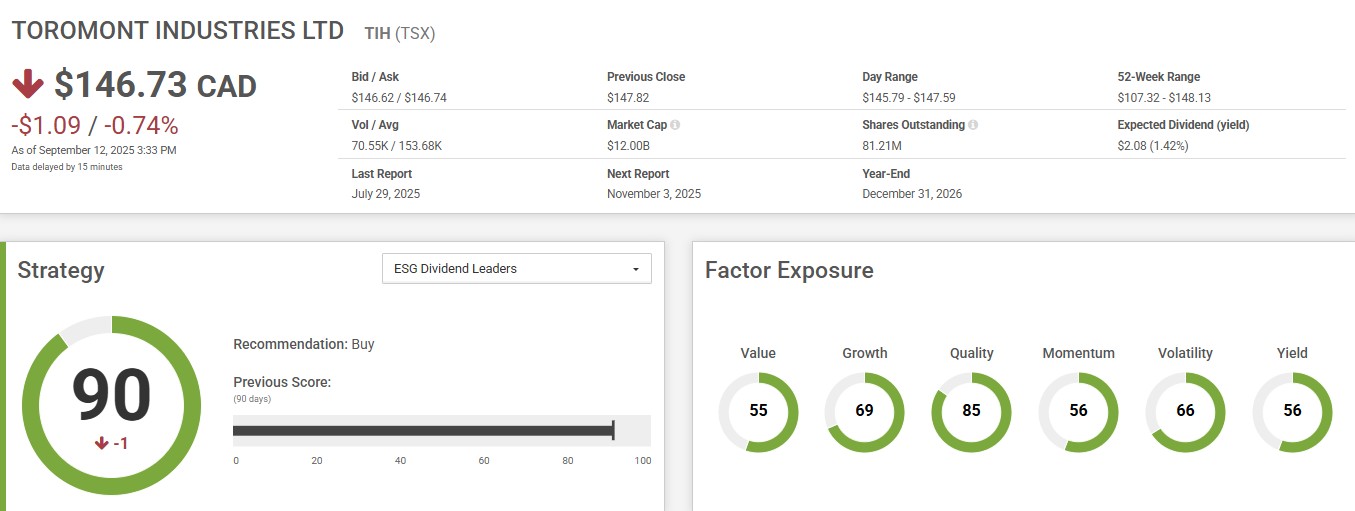
Toromont Industries has a Quality score of 85 and a Growth score of 69, indicating its stability and growth ability ranking compared to its sector and the overall market. CPMS helps determine the most suitable strategy for a stock, and Toromont’s strong scores in Quality and Growth make it an ideal fit for the ESG Dividend Leaders strategy. The ESG dividend strategy is designed for sustainability-conscious & income-oriented investors seeking to invest in financially stable companies. The strategy looks for stocks that have maintained a minimum dividend yield, earnings expectations and met minimum ESG risk rating. However, Toromont’s Value score of 55 suggests it may not provide a significant value capture for investors with value-investing strategies.
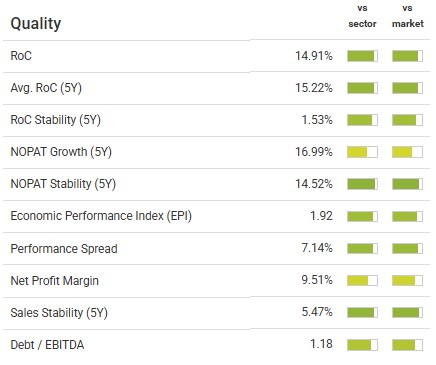
A review of Toromont’s key metrics highlights why the company fits well within a ESG Dividend Leaders. In CPMS’s Factors Detail section, Toromont ranks over 80th percentile for nearly all quality measures, both within its sector and across the broader market. Notably, the company demonstrates a NOPAT stability (5Y) of 14.52% and an avg. ROC 15.22%, underlining its consistent earnings and profit generation. Additionally, an Economic Performance Index of 1.9 reflects Toromont’s ability to create economic value, achieving a return on capital that is 1.9 times its cost of capital.
Stantec Inc. (STN-T)
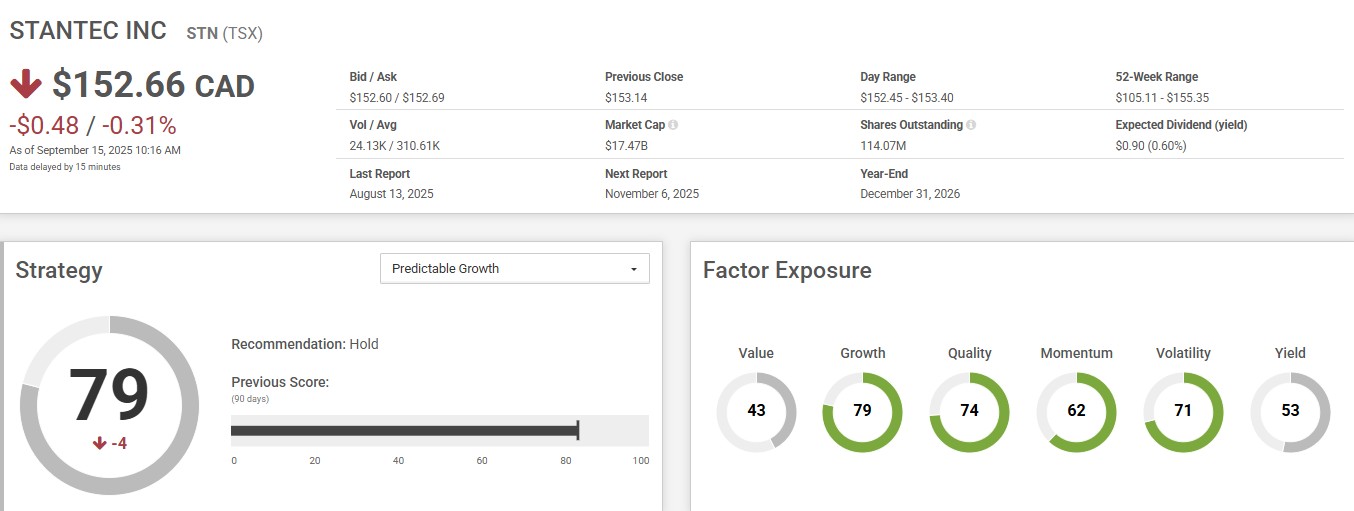
Stantec stands out in growth, with a score of 79 in that category. Therefore, it has a great score in CPMS’s Predictable Growth strategy. The Predictable Growth strategy is designed for conservative investors seeking growth at a reasonable price. The strategy places significant emphasis on growing book values and low earnings variability. It also looks for a low price-to-book ratio and quarterly earnings momentum.
Over the past five years, this strategy has outperformed the S&P TSX by 14.56%.
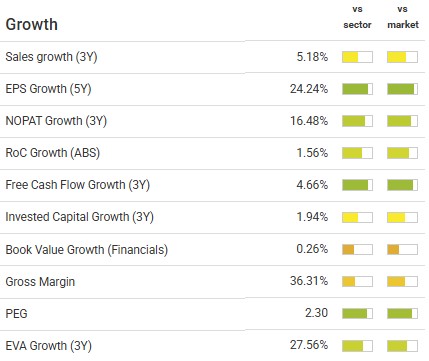
A review of Stantec’s key metrics highlights why the company fits well within CPMS’s Predictable Growth strategy. In CPMS’s Factors Detail section, Stantec has an incredible Free cash flow growth (3Y) of 95.22 per cent. Notably, the company demonstrates a PEG ratio of 0.96 showcasing its valuation justified by its impressive growth. The company has also shown an impressive18.1 per cent Sales(3Y) and 18.5 percent EPS (5Y) growth. Lastly, the book value growth of 17.2 per cent indicating a strengthening financial position.
Loblaw Companies (L-T)
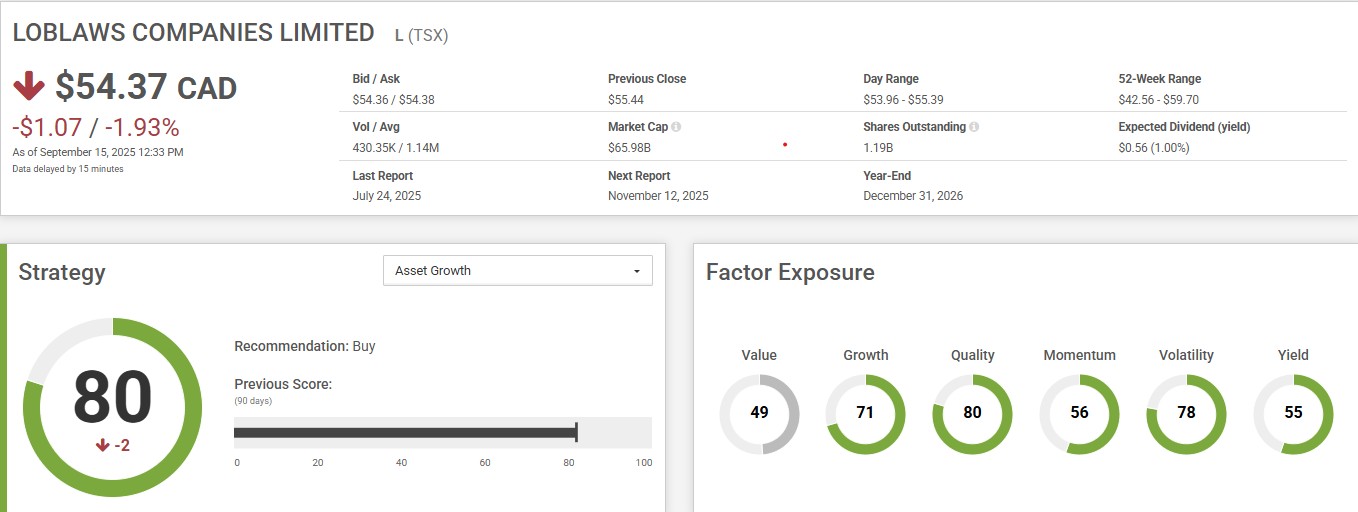
Loblaw has a Quality score of 80 and a volatility score of 78. Additionally, it scores 80 in the Asset Growth strategy. The CPMS Canadian Asset Growth Strategy is suited for investors seeking high growth rates through stocks with high reinvestment rates. It also looks at stocks with high earnings estimate revisions, quarterly sales momentum and earnings surprise.
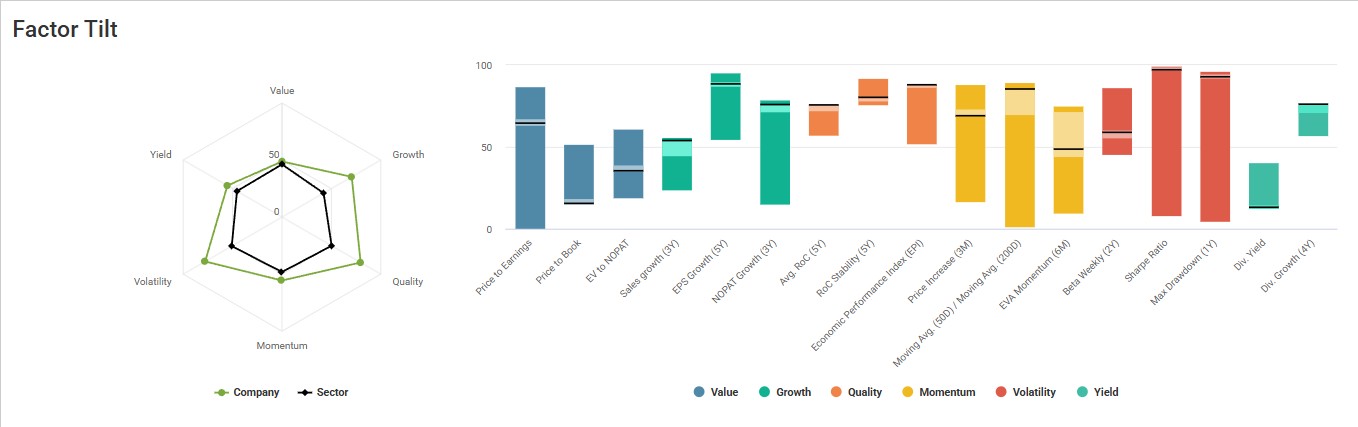
CPMS’s Factor Tilt tool provides a compelling view of the company’s strengths, highlighting its solid positioning in quality, growth, and volatility factors. Diving into individual metrics, we see that Loblaw has consistently ranked in the 75th to 91st percentile for ROC stability(5Y), indicating sustainable profitability and compounding. Similarly, for the EPS growth (5Y), it has maintained a percentile range between 75th and 91st, reflecting growing profits and financial strength. Additionally, in terms of Volatility factor, Sharpe ratio has been between the 98th and 96th percentile over the past year showcasing its incredible risk adjusted returns. These insights from the CPMS engine reveal the company’s resilience and strength, not just at the factor level, but also across key individual metrics.
By leveraging the CPMS engine, investors can screen and identify stocks that align with specific investment criteria. In this analysis, we focused on non-cyclical stocks that are Industry leaders with higher gross margins relative to their peers, stable return-on-capital with modest growth and fair valuation. Toromont Industries, Stantec Inc. and Loblaw all demonstrated these key metrics, emphasizing growth along with quality and resilience to face a weaker Canadian economy as explained in our number cruncher blogpost. While these stocks offer predictable returns and stability, investors must be willing to accept the inherent risks associated with macroeconomic investing.
In conclusion, the CPMS engine provides a valuable tool for identifying high-potential stocks that align with specific investment strategies. By focusing on strong price momentum and earnings growth, investors can make more informed decisions. However, it is essential to consider individual risk tolerance and investment objectives before making any commitments. A well-balanced approach that incorporates both fundamental analysis and strategic insights from CPMS can help investors navigate market uncertainties and optimize portfolio performance.