In our last Number Cruncher, we discussed how MSCI Inc (MSCI: NYSE), Shutterstock Inc (SSTK: NYSE) & Henry Jack & Associates Inc (JKHY: NYSE) are Information Technology companies that demonstrate high quality and consistently deliver cutting-edge solutions that meet the evolving needs of the market.
MSCI Inc:
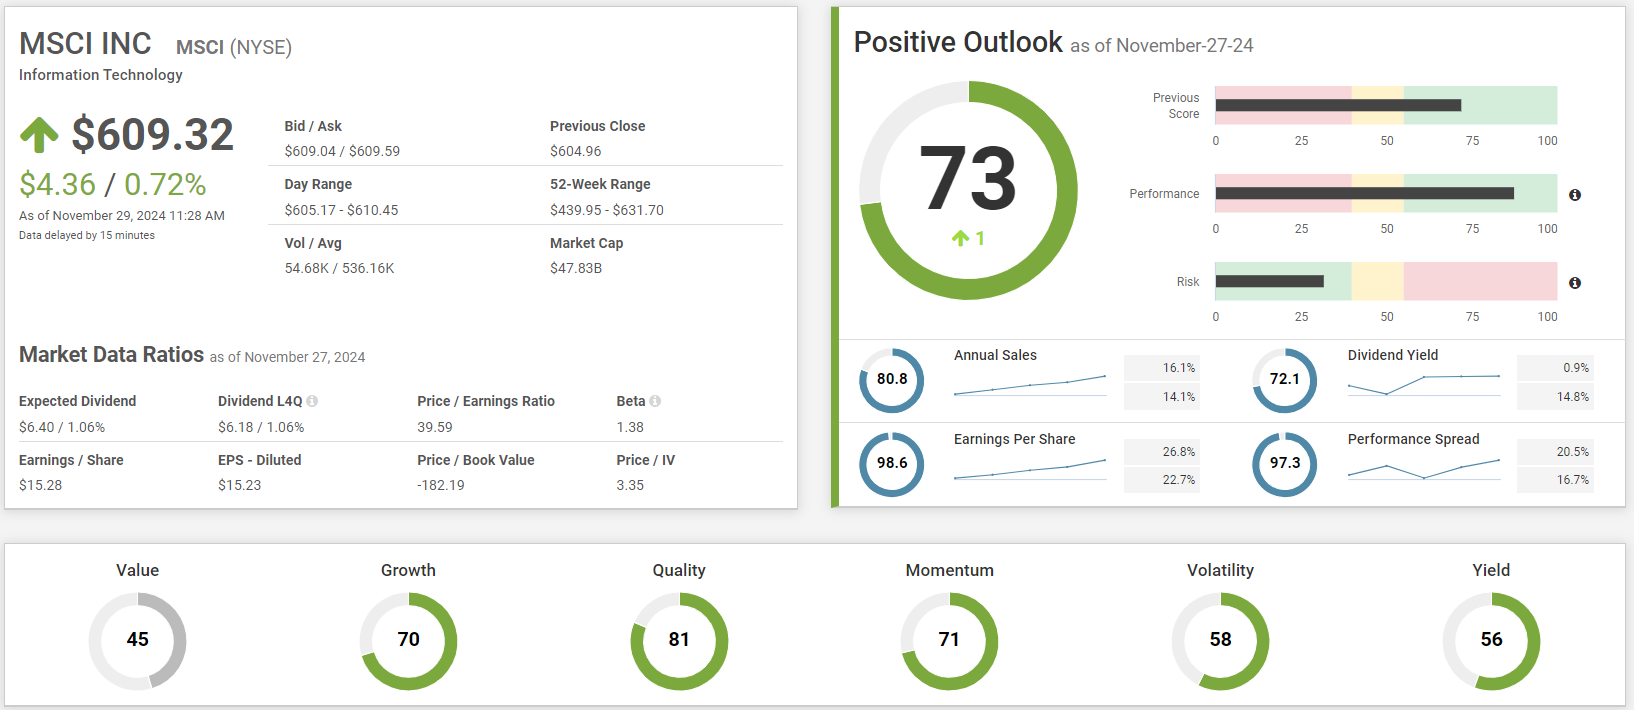
MSCI Inc (MSCI) currently holds an SP score of 73, reflecting a one-point increase over the past 90 days. This score is backed by a performance rating of 87.6 and a risk score of 31.9. Notably, MSCI has achieved its highest scores in the areas of quality (81), momentum (71), growth (70), volatility (58) and yield (56) indicators, highlighting its strong performance across multiple dimensions.
MSCI has experienced a 16.1% increase in annual sales, along with a 26.8% rise in earnings per share (EPS) in the last year. On average, over the past five years, the company has maintained a solid 14.1% growth in annual sales, with EPS growing by 22.7%, highlighting consistent growth in both revenue and profitability over time.
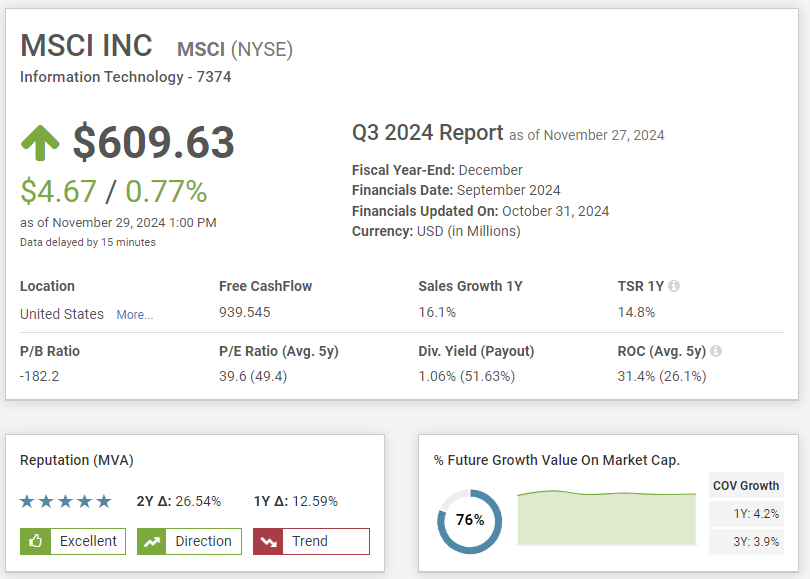
MSCI Inc. demonstrates impressive financial performance and strong market positioning. The company’s past year ROC of 31.4% and an average five-year ROC of 26.1% showcases efficient capital utilization, while its substantial Free Cash Flow of $939.545 million indicates robust cash generation capabilities. The elevated past year P/E ratio of 39.6 and average five-year P/E ratio of 49.4 reflecting investors confidence in the company’s future prospects.
MSCI’s FGV% of 76% underscores high market expectations for significant increase in value over time. This optimism is further supported by positive one-year COV growth of 4.2% and 3.9% growth over past three year, depicting a steady operational improvement.
Shutterstock Inc:
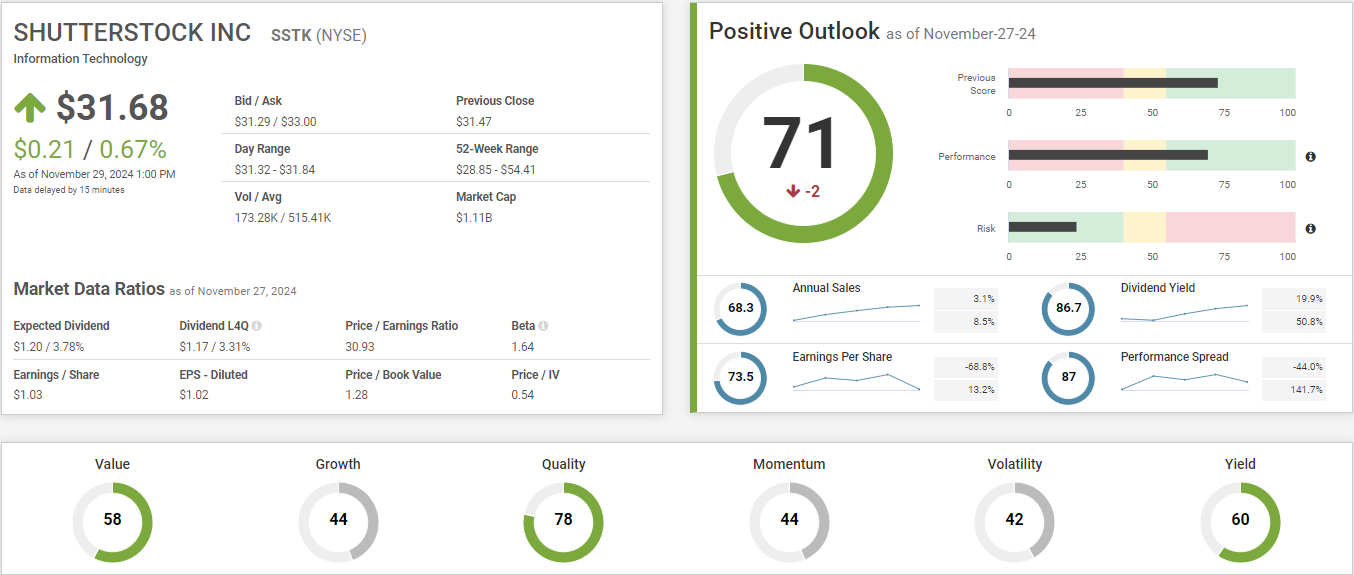
Shutterstock Inc (SSTK) currently boasts a SP Score of 71, with a decrease of 2 points over the past 90 days. This score comprises a performance score of 69.6 and a risk score of 23.9. Among its peers, Shutterstock excels in quality, yield and value, with scores of 78, 60 and 58, respectively. The company experienced an annual sales growth over the past year of 3.1% and an average five-year sales growth rate of 25.6%. Additionally, dividend yield has surged by 19.9% in the past year and on an average five- year increase in dividend yield was by 50.8%.
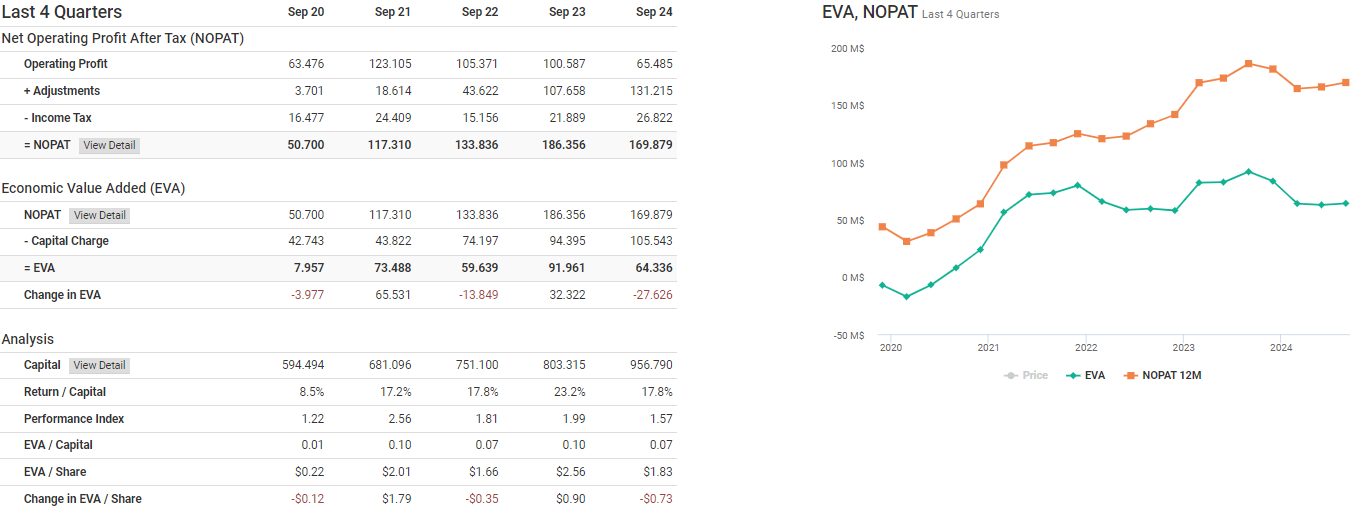
NOPAT has shown substantial growth, increasing from $51 million in September 2020 to $170 million in September 2024, with a peak of $186 million in September 2023. Return on Capital has also improved from 8.5% in 2020 to 17.8% in 2024, peaking at 23.2% in 2023. In contrast, EVA has also shown growth, starting at $8 million in September 2020, peaking at $92 million in September 2023. However, there was a decline in September 2024 to $64 million. A one-year decline in EVA amid an overall increasing trend suggests a temporary setback in the company’s ability to generate value above its cost of capital, potentially due to short-term challenges or investments.
Henry Jack & Associates Inc
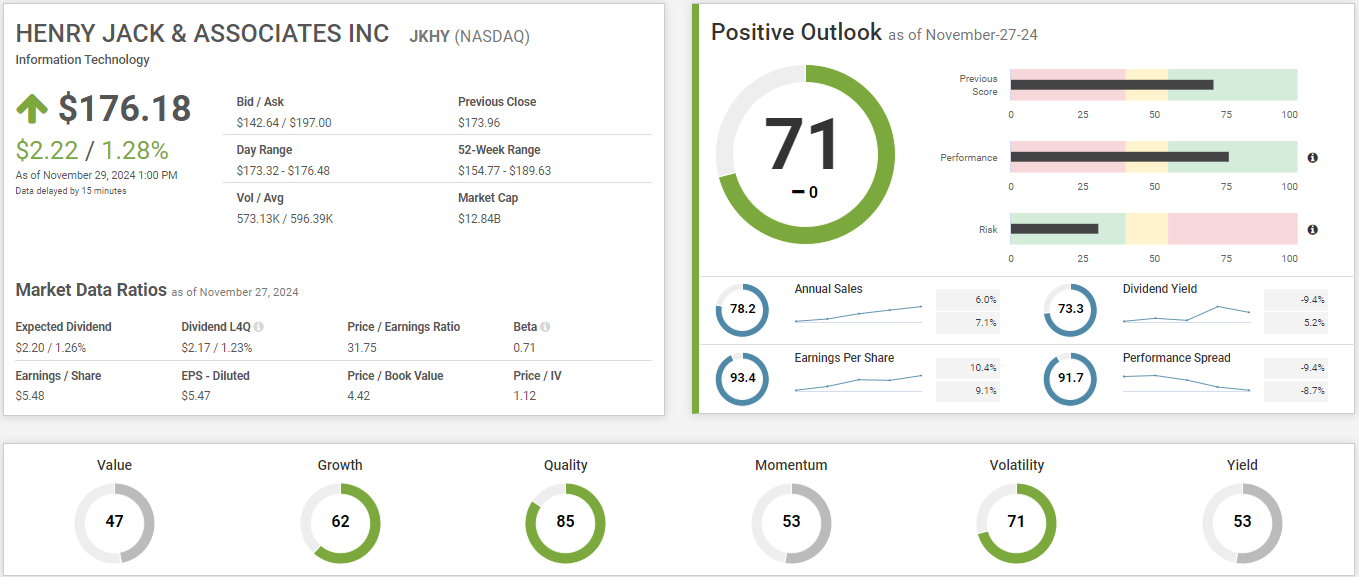
Henry Jack & Associates Inc (JKHY) has demonstrated strong performance, reflected in its current SP Score of 71, which has seen no change over the past 90 days. This score is supported by an impressive performance score of 76.3 and a risk score of 30.9. The company excels in several key areas, particularly in Quality, which stands out with a score of 85, while Volatility and Growth score is 71 and 62.
Henry Jack & Associates Inc performance has been up to the mark, with sales growth of 6% in the past year and a five-year average of 7.1%. Earnings per share (EPS) have increased by 10.4% over one-year and by 9.1% for five-year average. These metrics highlight Henry Jack & Associates Inc robust operational efficiency and its ability to convert revenue growth into enhanced profitability. Nevertheless, investors should carefully consider the company’s valuation in light of its performance and growth trajectory.
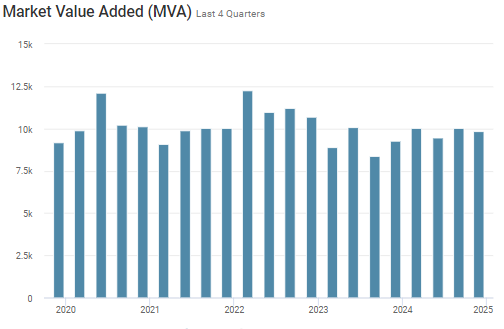
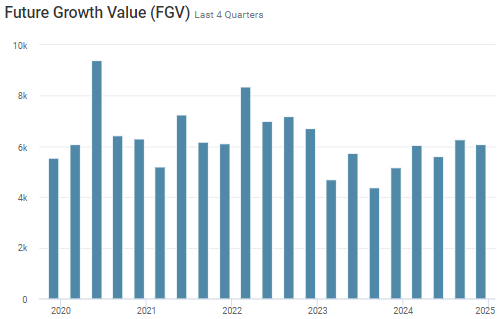
The Market Value Added (MVA) trend shows a generally stable pattern with a slight dip followed by a partial recovery in the most recent periods. This suggests that while the market’s overall assessment of the company’s value remains positive, there has been some fluctuation in investor sentiment. Similarly, the Future Growth Value (FGV) trend indicates variability, with a noticeable decline followed by a rebound in the latest years. This pattern reflects changing market expectations about the company’s future growth prospects.
If you have any questions about the article, feel free to contact Anthony:
amenard@inovestor.com