Introduction
The year 2025 was favorable for U.S. equities. The S&P 500 ended the year up 17.88%. Against this backdrop, the median return of U.S. factor models stood at 14.87%, below the market. Behind this average, however, lies a pronounced gap between a small group of very strong performers and several models that lagged meaningfully.

Top-Performing Models
The five leading models clearly benefited from exposure to the most supportive segments of the market.
The US Price Momentum CPMS Model ranked first with a return of 29.63%. Its heavy exposure to technology and communication services, including Nvidia, Meta Platforms, Microsoft, and Broadcom, allowed it to fully capture momentum tied to artificial intelligence and digital infrastructure.
Close behind, the US Asset Growth CPMS Model delivered 26.50%, supported by a similar mix of large technology leaders and companies investing aggressively for future growth.
The US Earnings Momentum CPMS Model posted 25.10%, benefiting from rapid earnings growth across several technology and industrial companies well positioned in the current cycle.
The US Earnings Value CPMS Model generated 21.97%, combining dominant technology holdings with financial institutions such as JPMorgan and Goldman Sachs, as well as industrial names like Caterpillar.
Rounding out the top group, the US Large Cap D10 IncomeAsset Growth CPMS Model returned 21.13%, reflecting a balanced exposure between large-cap technology companies and solid financial holdings.
Models Lagging the Market
At the other end of the spectrum, five models significantly underperformed the market in 2025.
The US Earnings Growth CPMS Model posted a return of -3.68%, weighed down by a more defensive positioning and limited exposure to the strongest technology segments.
The US Quality Growth Opportunities CPMS Model advanced only 0.30%, reflecting a heavier allocation to healthcare and consumer staples, including Johnson & Johnson and Procter & Gamble, which provided stability but little growth.
The US Dividend Growers CPMS Model recorded 4.62%, consistent with its focus on dividends and holdings such as Coca-Cola and Bank of America, which were less favored in a growth-driven year.
The US Dangerous CPMS Model ended the year at 5.96%, reflecting a more cautious structure with limited exposure to leading technology stocks.
Finally, the US D10 DividendEarnings Growth CPMS Model delivered 7.65%, constrained by its exposure to utilities and telecommunications, including Verizon, which underperformed the broader market.
Overall Perspective
The year 2025 once again highlighted the importance of sector positioning. Models with meaningful exposure to technology and high-growth companies significantly outpaced the market. In contrast, more defensive and income-oriented approaches provided stability but delivered materially lower returns.
Conclusion
In 2025, performance was concentrated in a small number of dominant sectors and stocks. Models that embraced this concentration generated returns well above 25% in some cases. More conservative models fulfilled their stabilizing role but trailed the S&P 500 by a wide margin. This balance between styles remains essential to navigating market cycles with discipline and consistency.
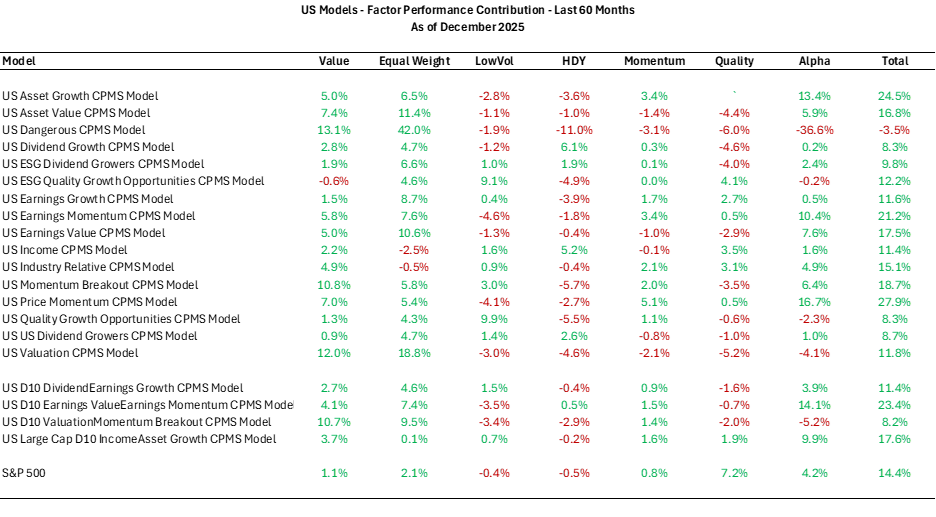
Performance – Factor Contribution (Last 5 years)