We used the CPMS engine to screen the U.S. stock universe (excluding utilities, health care, consumer staples and real estate under GICS classification) for companies in the top 25th percentile with industry-relative quarterly cash-flow momentum at least 10 percentage points above their industry average, a five-year average return on invested capital above 10 per cent establishing profitability, and an EBIT margin above 20 per cent to ensure operational efficiency. We also applied a valuation cap with a trailing P/E below 30x and added a three-year average earnings standard deviation filter to get reasonable valued companies and a stable, consistent EPS.
The three stocks that met these criteria were 3M (MMM-N), Honeywell International Inc. (HON-N) & PTC Inc. (PTC-Q).
3M Company (MMM)
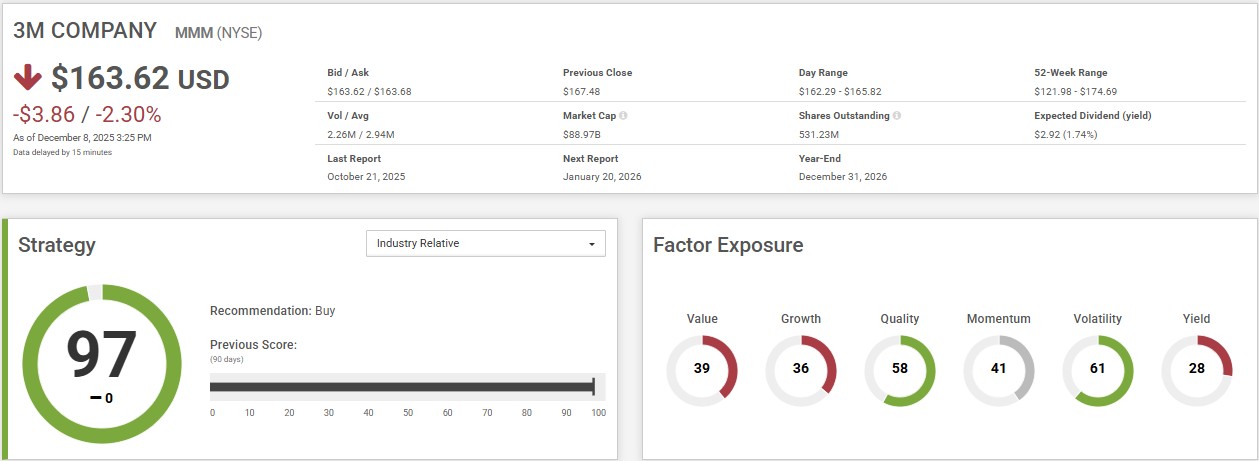
3M has a Quality score of 58 and a volatility score of 61, indicating its stability and strong ranking compared to its sector and the overall market. CPMS helps determine the most suitable strategy for a stock, and Colgate’s strong scores in Quality and strength in Earnings stability make it an ideal fit for the Industry Relative strategy.
The Industry Relative strategy is designed for investors seeking industry diversification. The strategy uses both growth and value criteria that is measured against each stock’s industry group. Earnings momentum, estimate revisions, earnings surprise as well as market recognition variables are also emphasized. 3M’s high industry relative quarterly cashflow momentum makes it to be suitable for the strategy. However, the stock’s low value score of 39 suggests that it might not be for Investors who are seeking value investments.
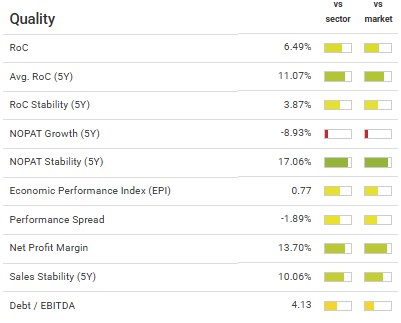
A review of 3M’s key metrics highlights why the company fits well within our screen for quality companies. In CPMS’s Factors Detail section, 3M ranks well for quality measures, both within its sector and across the broader market. Notably, the company demonstrates an avg. ROC (5Y) of 11.07per cent and NOPAT stability of 17.06 per cent, underlining its sustainable earnings and profit generation.
Honeywell International Inc. (HON)
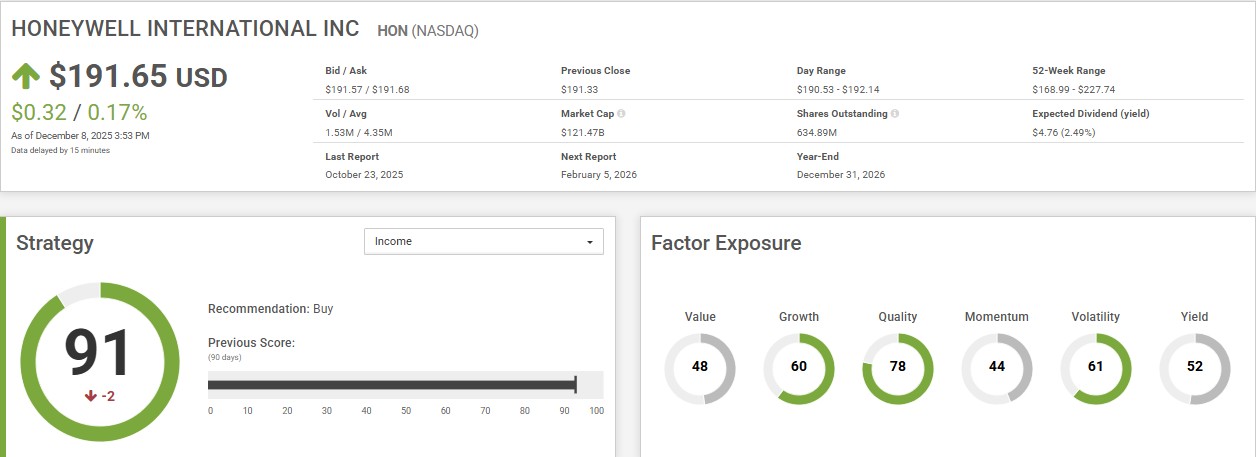
Honeywell International has a Quality score of 78 and a volatility score of 61, indicating its stability and strong ranking compared to its sector and the overall market. CPMS helps determine the most suitable strategy for a stock, and Honeywell’s strong scores in Quality and strength in dividend stability make it an ideal fit for the Income strategy.
The Income strategy is designed for income-oriented investors. This strategy selects large cap stocks with high dividend yields compared to their peers and with high return on assets and equity whose expectations of future earnings are increasing. Honeywell’s expected yield of 2.49 per cent suggests it to be suitable for income seeking investors. However, the stock’s low momentum score of 44 suggests stability in stock price so it might not be for Investors seeking price appreciation and it is advisable to consider this fact when considering the stock.
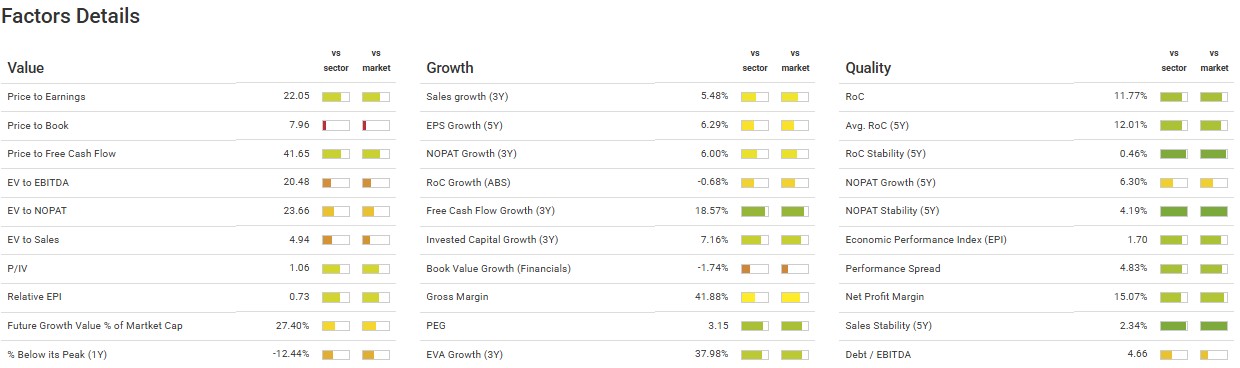
A review of Honeywell’s key metrics highlights the strength in quality and dividend. In CPMS’s Factors Detail section, the company shows an impressive free cash flow growth (3Y) of 18.57 per cent, EVA growth (3Y) of 37.98 per cent and a PEG ratio of 3.5x. A higher PEG ratio demonstrates its growth much stronger than the market is valuing it on a P/E of 22.05x. These figures highlight that the stock is a value, growth and quality company with strong cashflow growth, stable operating earnings and a dividend (5Y) volatility of 0.7 per cent.
PTC Inc (PTC)
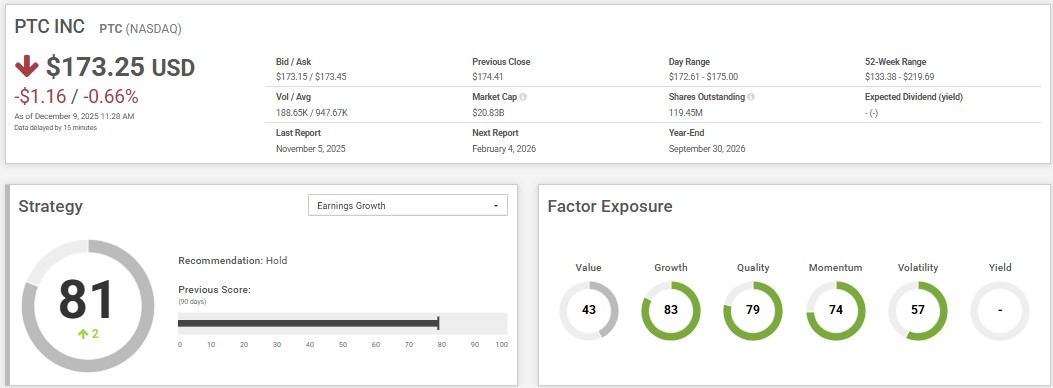
PTC Inc. has a growth score of 83 and a quality score of 79. Additionally, it scores 81 in the Earnings Growth strategy. The CPMS US Earnings Growth Strategy is suited for investors seeking high growth rates. It is designed to select stocks with strong reported returns on equity. The strategy emphasizes stocks with high current profitability to equity ratios. Importance is also placed on stocks with high earnings estimate revisions and earnings surprise. PTC’s high growth and quality metrics makes it to be suitable for the strategy.
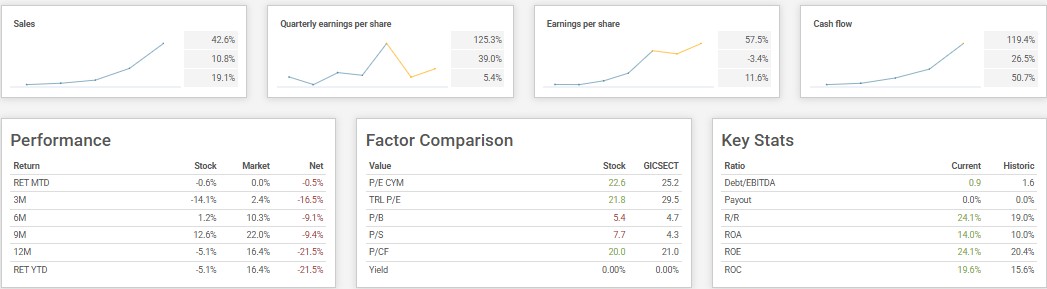
CPMS’s provides a compelling view of the company’s growing sales, cashflow and earnings. Diving into individual metrics, we see that PTC has a quarterly sales growth of 42.6 per cent and the company’s quarterly and annual cashflow momentum to be 26.5 and 50.7 per cent respectively. Analyzing PTC’s comparison with its own sector shows it has been trading at a better price-to-earning and price-to-cashflow.
Lastly, comparing the current key stats with its historic values informs us about the higher reinvestment rate, return on assets, return on equity along with an improvement in its debt-to-EBITDA from 1.6x to 0.9x. These insights from the CPMS engine reveal the company’s resilience and strength, not just at the factor level, but also across key individual metrics giving an opportunity to investors seeking quality investments at cheaper valuations.
Conclusion
By leveraging the CPMS engine, investors can screen and identify stocks that align with specific investment criteria. In this analysis, we focused on stocks that may benefit from a steepening yield curve scenario. 3M (MMM-N), Honeywell International Inc. (HON-N) & PTC Inc. (PTC-Q) all demonstrated these key metrics, emphasizing quality along with growth.
In conclusion, the CPMS engine provides a valuable tool for identifying high-potential stocks that align with specific investment strategies. However, it is essential to consider individual risk tolerance and investment objectives before making any commitments. A well-balanced approach that incorporates both fundamental analysis and strategic insights from CPMS can help investors navigate market uncertainties and optimize portfolio performance.