In our last Number Cruncher, we discussed how SLM Corp (SLM:NASDAQ), Vector Group Ltd. (VGR:NYSE) & New Market Corporation (NEU:NYSE) are companies with compelling valuations with positive EVA generation.
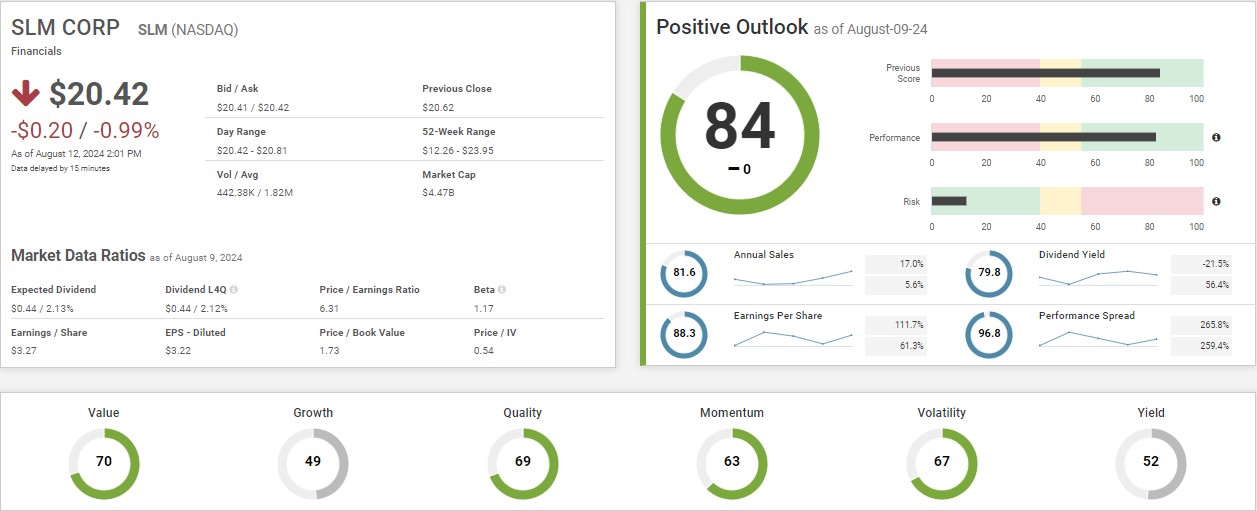
SLM Corp currently has an SP Score remains unchanged at 84 compared to 90 days prior, comprising a Performance Score of 82.7 and a Risk Score of 12.9. SLM’s strongest factors compared to its peers are Value and Quality. The company experienced an incredible 265.8% performance spread growth, and the 5-year average performance spread growth of 259.4%. Performance spread indicates company’s ability to generate value over its cost of capital thereby showcasing value creation for shareholders.
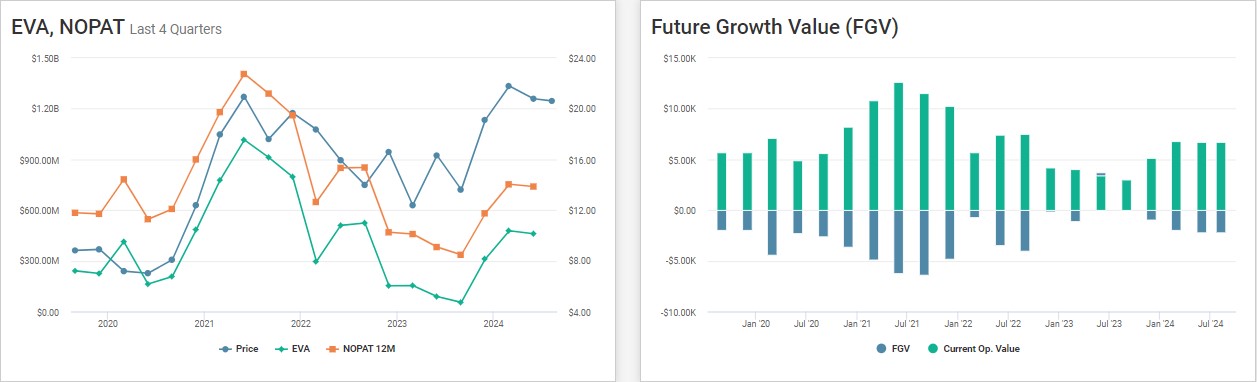
The EVA and NOPAT graph for the last 4 quarters exhibits the company’s turnaround of a declining NOPAT to gradually increasing. Notably, their net operating profit after taxes (NOPAT) has increased exponentially just in the last year going from 381.7 million in June 2023 to 739.7 million in June 2024. The EVA graph also showcases the sudden growth in intrinsic value for the shareholders from 88.9 million (June 2023) to 460.6 million (June 2024). The future value growth graph reflects to be the lowest in the past year. The better performance spread & NOPAT growth, along with negative FGV indicates an undervaluation of the stock by the market.
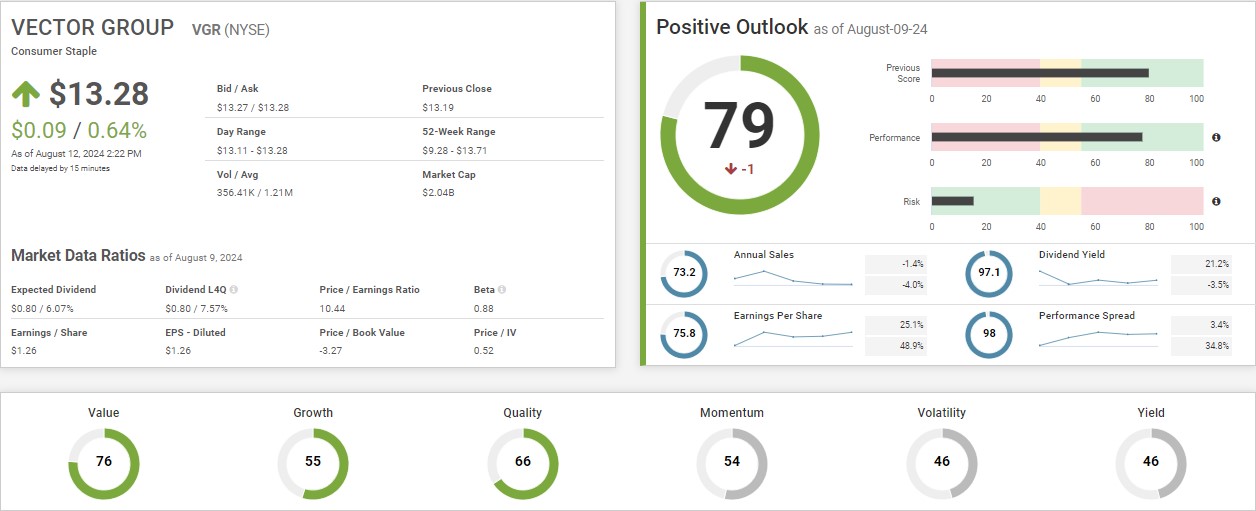
Vector Group currently has an SP Score of 79 which has decreased by 1 in the past 90 days. The SP Score is based on a performance score of 77.6 and a risk score of 15.6. Currently, Vector Group top factors are Value, scoring 76, and Quality, scoring 66. The company had an annual growth rate of 25.9% and a steady earnings 5-year average growth of 48.9%.
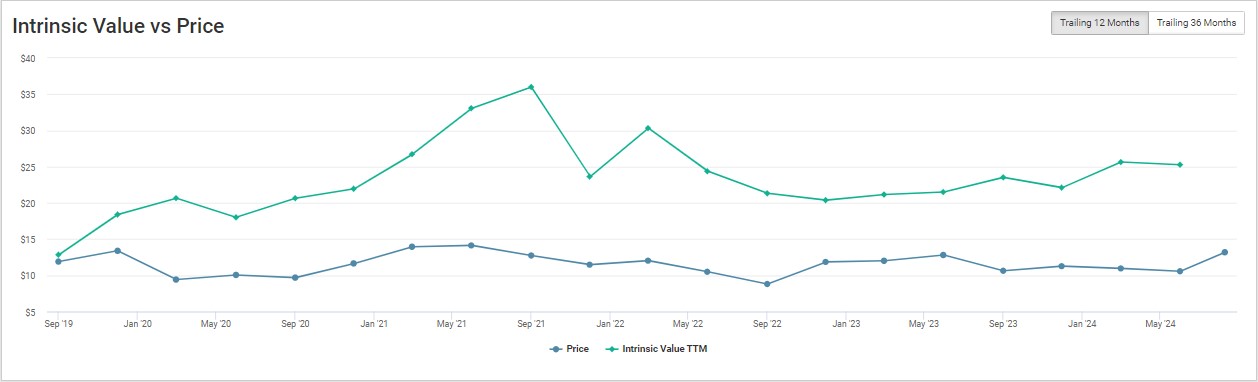
The intrinsic value chart depicts a constant undervaluation in the intrinsic value of the company for trailing 57 months. Our estimation shows that the company was fairly valued in September 2019 and since then the company has been undervalued. The market price is yet to catch up to its intrinsic value. Vector Group continues seems to be a strong company leading its peers at a compelling valuation.
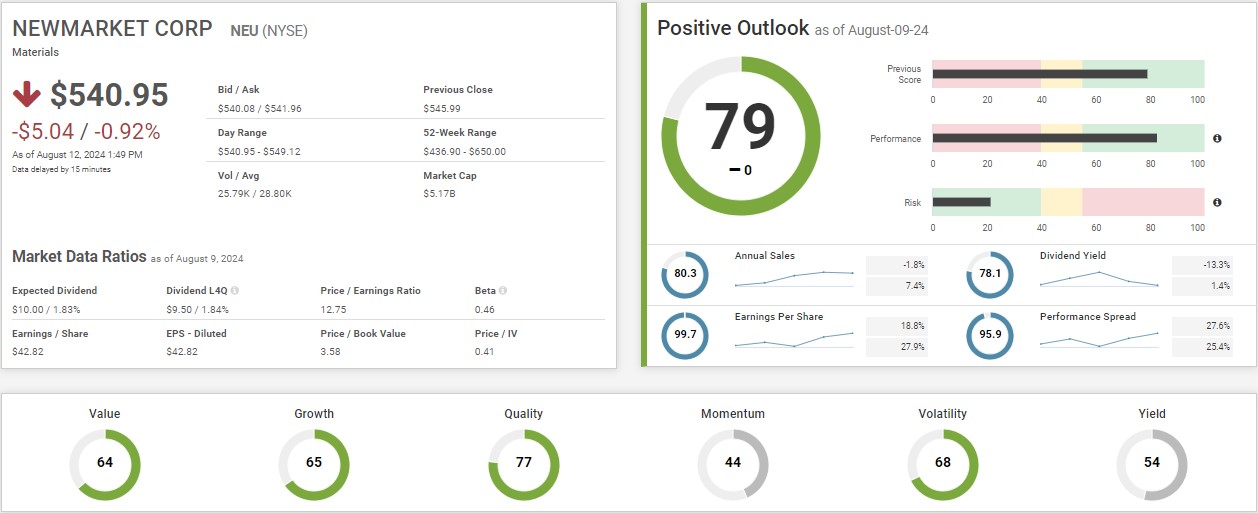
Newmarket Corp current SP Score is 79, stayed the same in the past 90 days. Their performance score is 82.6 and their risk score is 21.5. The company’s strongest factors compared to its peers are quality and volatility with respective scores of 77 and 68. New Market’s performance spread has averaged 27.6% for the last year and in the past 5 years averaged about 25.4%.
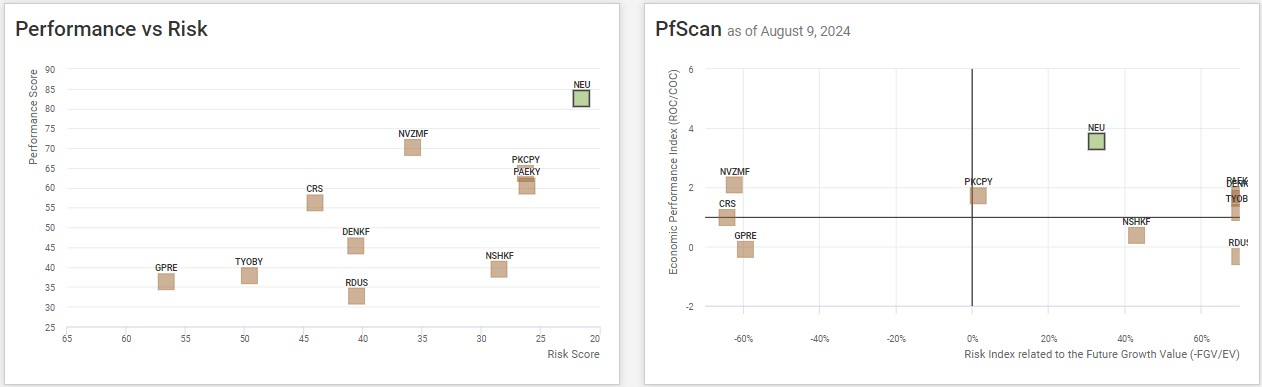
Newmarket Corp performance risk charts show a comparison between the company and its peers in the same sector. It lies with highest performance score and lowest risk score. The PfScan showcases its economic value generation (vertical axis) and undervaluation (horizontal axis). The company has an impressive Economic performance Index. It has been able to generate return on capital approx. 4 times its cost. Focussing on the horizontal axis, the company is about 30% undervalued when compared to its enterprise value. Therefore, based on our Stockpointer, the company seems to be efficient and trading at an attractive valuation.
If you have any questions about the article, feel free to contact Anthony:
amenard@inovestor.com