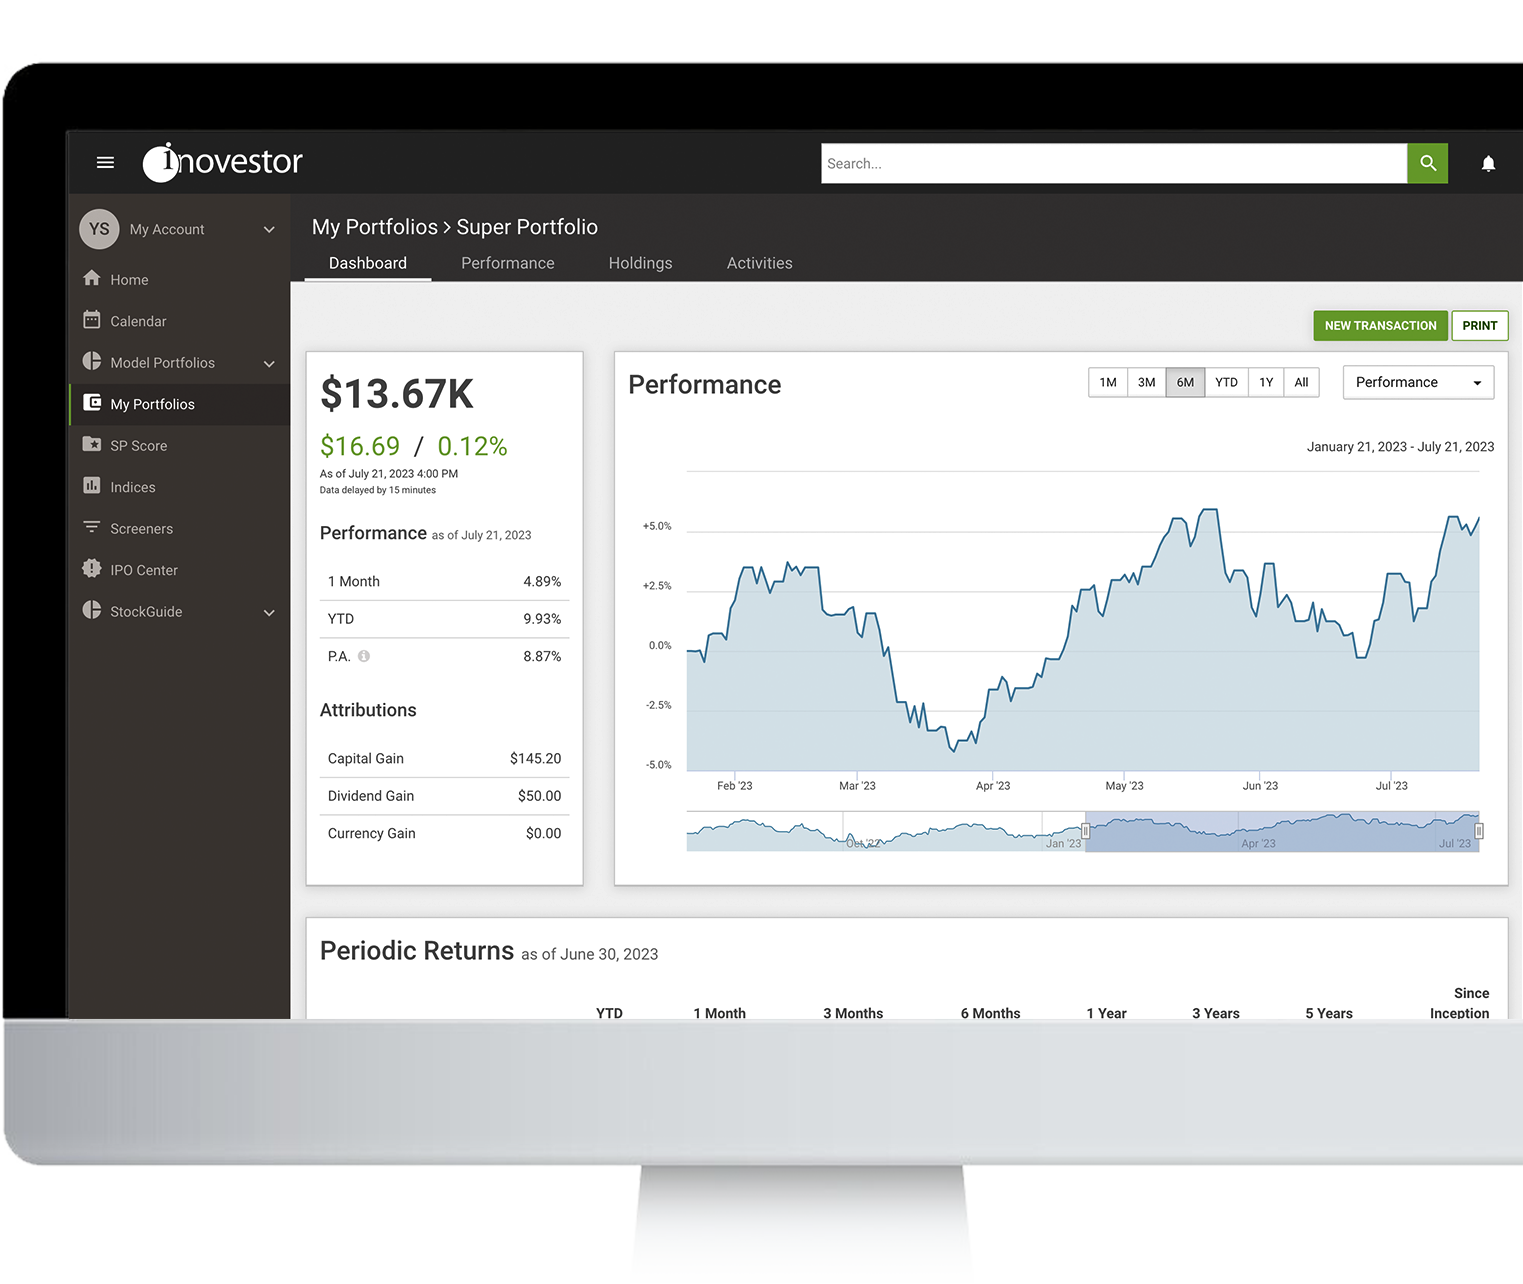
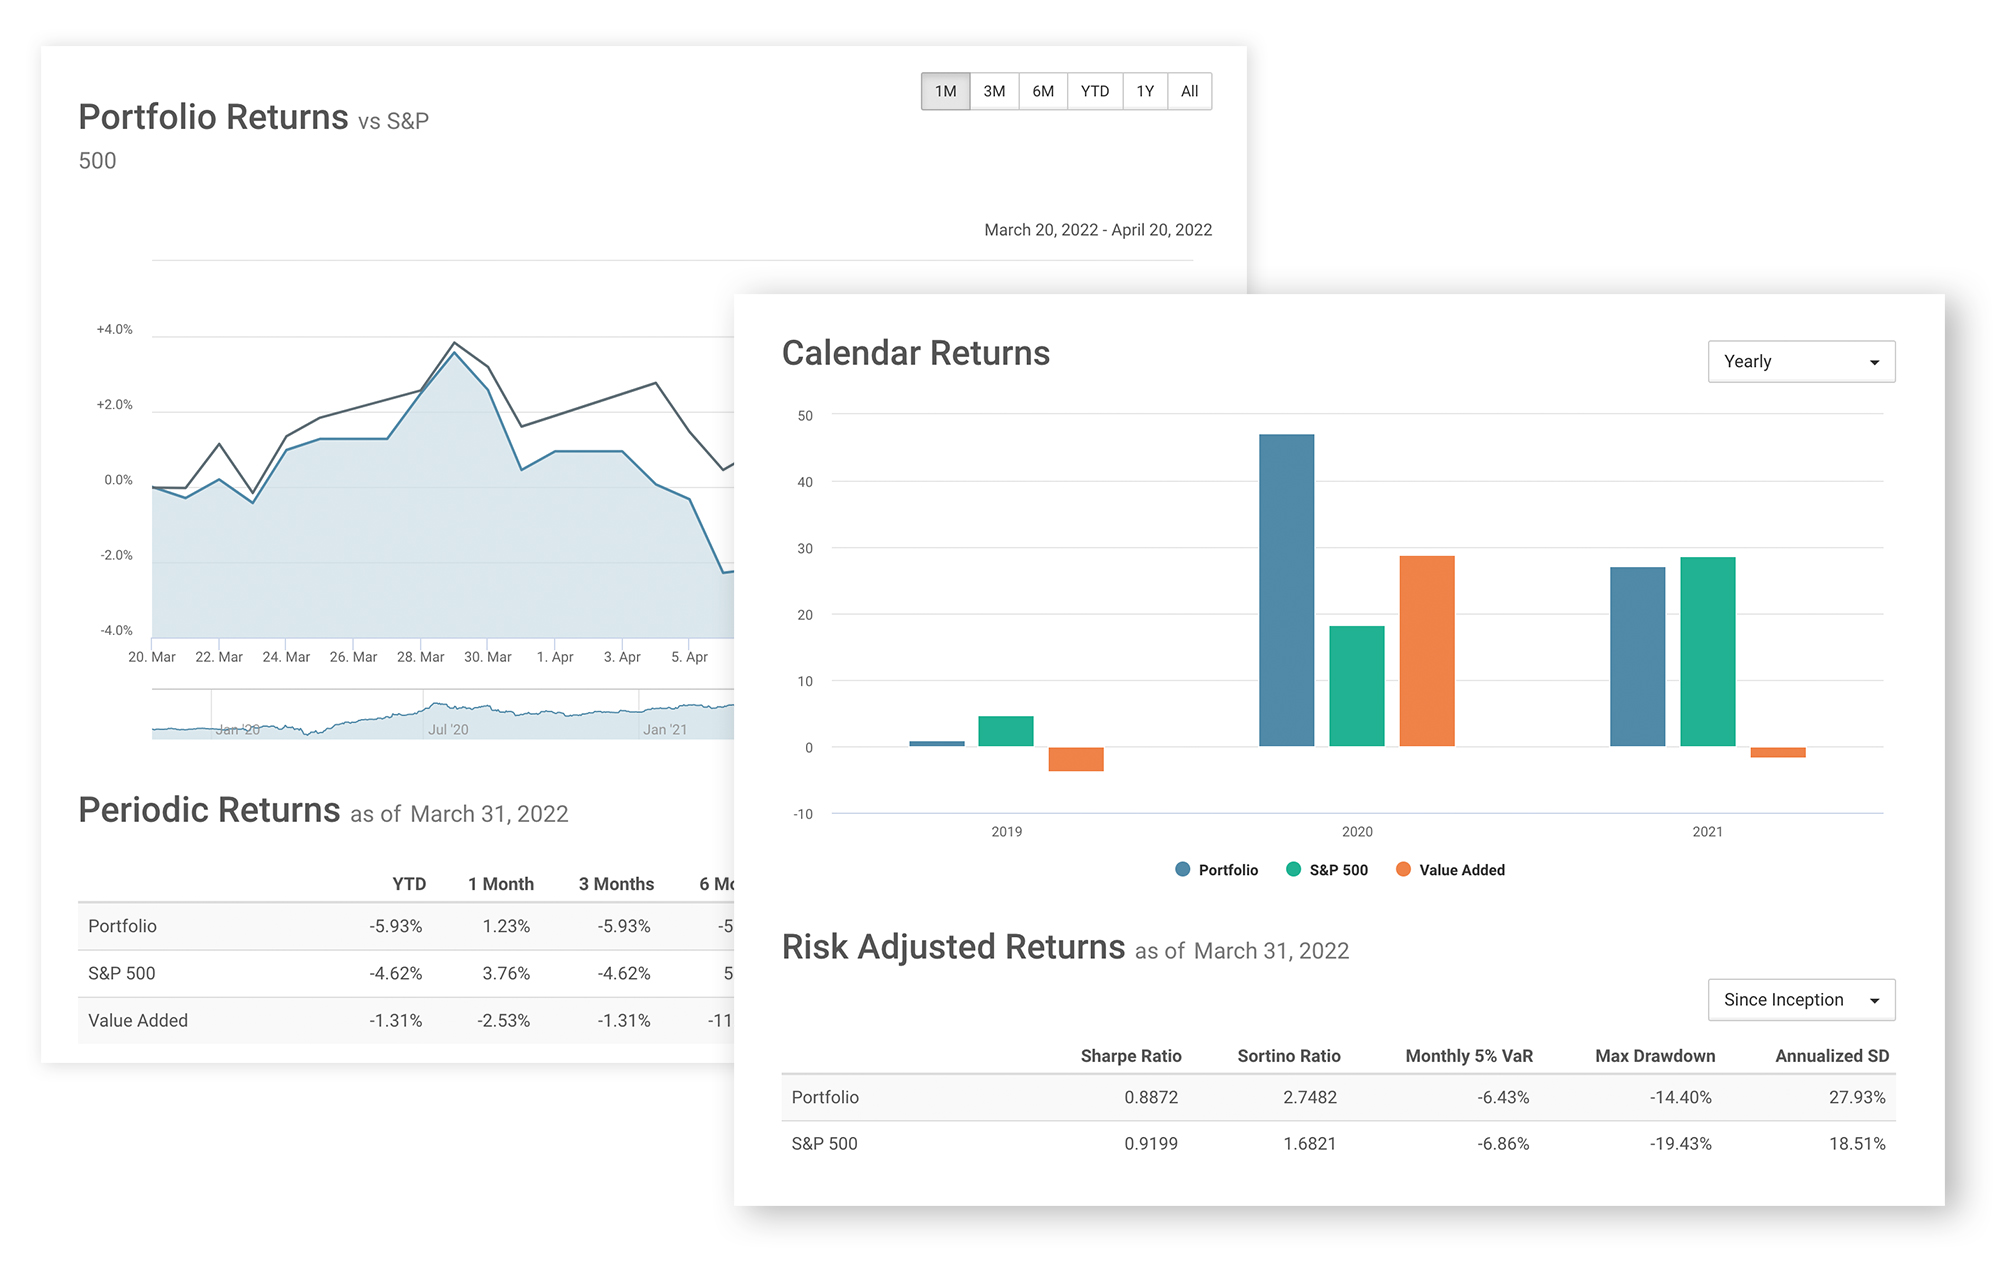
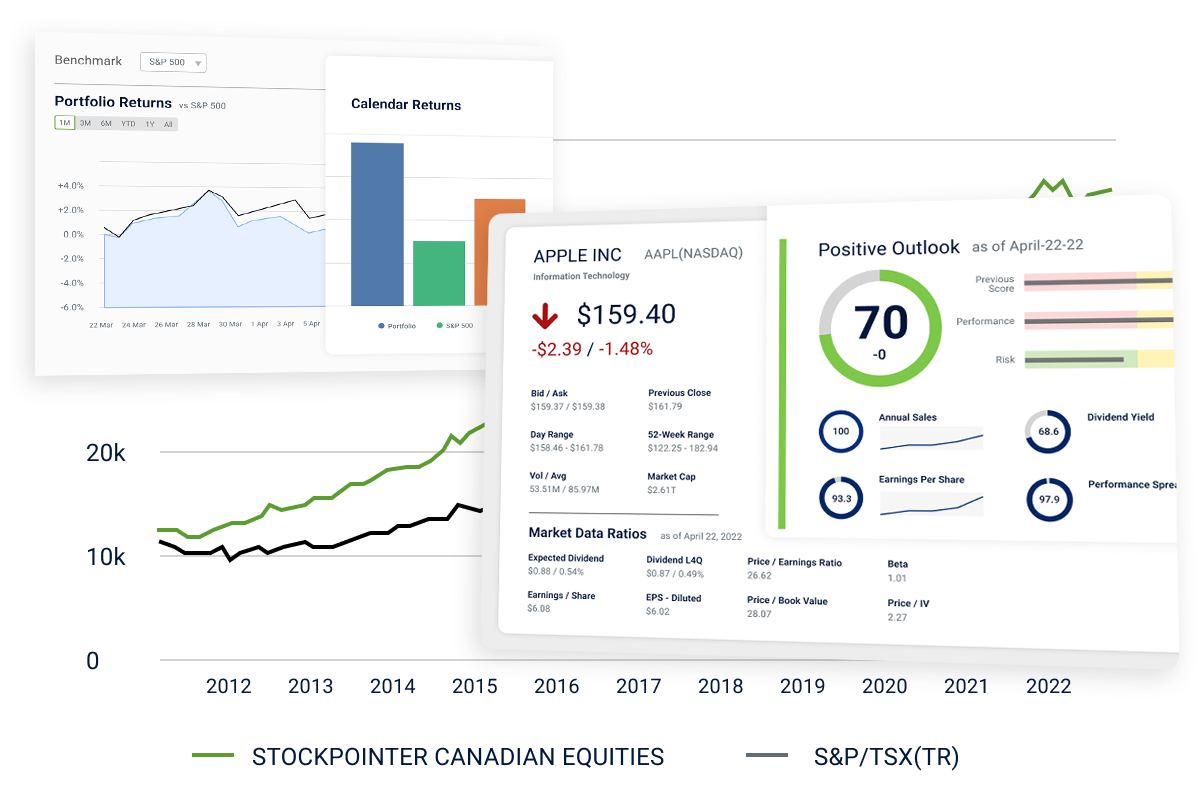
https://www.youtube.com/watch?v=3NoPOGpawpQ

Better Results And Less Hassle.
You Deserve It.

Watch the explainer

Investment Research Platform With The Features You Need

Generate higher returns

Our Canadian model portfolio has generated annualized returns of more than 5.9% above the S&P/TSX Total Return. In fact, it generated excess returns in over 80% of the quarters since inception.

Analyze a company in a snap

From our scorecard, you can analyze a company in less than one minute. Inovestor For Advisors is ideal to discover attractive investment opportunities.

Communicate with your clients

With our guided portfolios, you receive personalized monthly newsletters that can be used to keep your clients up to date. In addition, you receive quarterly reports of portfolio rebalancings.

Easy portfolio valuation

With a single click, find companies that diminish the returns of a portfolio and find alternative investments.

Embrace StockPointer

StockPointer is a 12 factor model that your customers understand. Using the economic profit theory, StockPointer finds quality companies trading at reasonable prices.

Outstanding support

Get access to phone support. Our account managers and product specialists address any questions you may have.

NEW: 12,000+ ESG risk ratings and data available now

Try for free for 14 days
Model Portfolio

Better margins through exceptional performance

The StockPointer methodology has generated industry-leading results for close to 20 years. Rely on Inovestor for Advisors for your stock picks and watch your margins take off into new levels of profitability.

You’ll be amazed to find out how much your money’s worth.

You would have an additional of AUM if you had a balance book of:

in 2008 and followed StockPointer's model portfolios.
Research

Quick and in-depth research

Whether you need to answer an ad-hoc request about an unknown company from one of your prospects or you need to find an alternative investment, you can consult one of our different reports – from Scorecards to full-fledged reports. Access a broad list of material when you follow our model portfolios.

Stock Of The Day
Communication Material

Engage with your customers frequently

On a bi-monthly basis, use our material to engage with your customers. Increase communication with customers with content such as trading ideas, rebalancing comments, and market summaries.

TRY FOR FREE
Prospecting

An image is worth a thousand words

When you analyze a prospect’s holdings, would you like to have a visual aid that displays graphically its investments and identifies the bad apples? Our portfolio scanner does just that while assisting you convert a prospect to a customer. It identifies stocks that under perform. And even if you invest solely in Mutual Funds it allows you to monitor investments and decide when to divest.

TRY FOR FREE
1
Y Axis The vertical axis represents the how much wealth is created to the shareholder, Anything above 1 is good, the higher the better. Under 1, the company generates less than the cost of capital and below 0, it actually destroys wealth.
2
X Axis The horizontal axis represents the how expensive is the stock, value stocks are generally located to the right and growth stock to the left.
3
Apple Apple is an expensive stock but generates highest wealth of all theses stocks and is trading at a higher discount than the other ones.
4
Twitter and Tesla Twitter and Tesla are both destroying wealth to their shareholders, and are extremely expensive. Most of the time, stocks in these area tend to perform poorly on the long run.
5
Google and Amazon These companies are generating wealth for their customers and are trading at a high premium.

More Services

Subscribers have access to many more features.

Guided Portfolio Services

Access information on portfolio rebalancing, market review, and in-depth company analysis.

SMA Platforms

If you like our model and you want to simplify your process, our SMA service will save you time.

Financial Concierge Services

We can help you with any specific task - from automating your investment model to creating customized filters.

Factor Based Overlay

Our team of specialists can assist you build your factor based model.

Individual

$ FREE

Per Month

Free access to:

ETF Center including INOC True NAV chart
ScoreCard of the day
Advanced Screener
Canadian IPO Data
Financial information on over 10,000 comapanies
Access to analytics from Nasdaq’s Dorsey Wright and Inovestor’s StockPointer for a fee


Join Now

ProMost Popular

$ 299

Per MonthFor Advisors

Single Access
Stock Analysis
ETF & Mutual Funds Analysis
Companies Ranking By Industry
Portfolio Analysis
Canadian, US and ADR Portfolios
Industry Weighting
Access To Top Performing Indexes
Custom Filters


Try For Free

Team

$ 399

Per Month

Best Value

All Features Of Pro plus:
Team Access
2 RIA Access included
Up To 5 Licenses
Assistants Get Free Access


Buy Now

Disclaimer. This is just for indication purposes and is based on a initial investment on April 2008 for the Canadian and June 2008 For the US and Global and all dividends are reinvested quarterly. The initial asset allocation is a 60/40 and portfolios are not re balanced. The initial country allocation is 30% Canadian, 20% United States and 10% Global. The StockPointer model portfolios include trading fees.